상수원 이용 호소(대청호) 내 니트로페놀류 및 살충제류 모니터링
Monitoring of Nitrophenols and Insecticides in the Daecheong Lake, Served as Resources of Drinking Water
Article information

Abstract
목적
본 연구는 대전을 포함한 한국 중부 지방의 상수원수로 사용되는 대청호 수역을 대상으로 니트로페놀류 3종(4-nitrophenol, 2,4-dinitrophenol, 2-methyl-4,6-dinitrophenol) 및 살충제류 5종(acetamiprid, dinotefuran, thiacloprid, triflumuron, chlorfluazuron)의 잔류실태 확인과 토지피복 및 월별 강수량 변화에 따른 물질의 거동 특성 파악을 목적으로 한다.
방법
2015년 6월부터 10월까지 매월 1회에 걸쳐 대청호 내 7곳의 지점에서 시료를 채수하였으며, 니트로페놀류 3종과 살충제류 5종은 고상 추출 카트리지를 통해 추출 후 LC-ESI/MS/MS를 이용하여 분석하였다. 니트로페놀류와 살충제류의 검출한계는 각각 0.4-1.2 ng/L, 0.2-5.0 ng/L 수준이며, 내부표준물질에 대한 평균회수율은 니트로페놀류(2,4,6-Tribromophenol) 93.1%, 살충제류(Acetamiprid-d3, Thiacloprid-d4) 각 68.7%, 41.3%로 나타났다.
결과 및 토의
3종 니트로페놀류의 검출빈도는 71.4-100% 수준이며, 총농도는 ND(불검출)-487 ng/L로 조사되었다. 5종 살충제류 중 네오니코티노이드계(acetamiprid, dinotefuran, thiacloprid)와 벤조일우례아계(triflumuron, chlorfluazuron)의 검출빈도는 각각 28.6-100%, 0-28.6% 수준으로 조사되었으며, 총농도 수준은 ND-253 ng/L로 나타났다. Mann-whitney U test를 이용한 지점별 농도분포를 통해 니트로페놀류와 살충제류 모두 하천 상류와 하류 및 호소간 유의한 차이를 보였다. 조사 기간에 따른 지점별 농도 변화와 강우량 비교를 통해 니트로페놀류 3종은 전반적으로 강우량이 증가함에 따라 농도가 증가하는 경향을 보였으나, 살충제류는 네오니코티노이드계에 한하여 하천 상류 및 하류에서 양의 상관관계를 보였고 호소의 경우 상관관계가 나타나지 않았다. 월별 농도 변화를 통해 산림 위주 단일 피복지인 주원천 상류에서 6월 검출되지 않았던 dinotefuran이 7-8월 증가추세를 보이다 9월 감소하는 결과를 보였고, 댐앞 및 문의, 추동, 품곡천 하류에서는 dinotefuran 농도가 7월 대비 10월에 20배 이상 급격히 증가하였다.
결론
인구 3,470,000명 이상의 상수원으로 사용되는 대청호 내 니트로페놀류 검출빈도는 70% 이상 높은 수준으로 나타났으나 미환경청 먹는물 수질기준 대비 약 1,000배 이상 낮은 수준으로 검출되었다. 살충제류 중 네오니코티노이드계 3종의 평균 검출빈도는 72.2%로 높은 빈도를 보였으나 미환경청 식수안전기준이 존재하는 acetamiprid는 기준치의 약 1% 미만 수준으로 조사되어 전반적으로 식수로써 안전한 수준으로 파악되었다. 지점별 농도 수준 분포와 강우량 변화 비교를 통해 산림 위주 단일 피복지인 하천의 상류에서 논, 밭, 주거, 교통 등 복합피복지인 하천 하류 및 호소로 갈수록 농도가 증가하고, 강수량 증가에 따라 농도가 증가하는 경향을 통해 니트로페놀류 및 살충제류 모두 강우와 같은 비점오염원의 형태로 하천 하류와 호소로 집적되는 것으로 나타났다. 월별 농도 변화를 통해 주원천 상류 및 본류 3개 지점에서 특정 시기에 dinotefuran 농도가 증가하였는데, 이는 소나무 재선충 매개역할을 하는 솔수염하늘소 산란시기와 철쭉에 발생하는 심식충, 방패벌레, 응애류 등 병충해 방지를 위한 농약 살포시기와 유사하여 살균제 사용이 금지된 상수원보호구역 내 직접적 농약 살포가 이뤄졌을 가능성을 암시한다.
Trans Abstract
Objectives
This study aimed to investigate distributions of three nitrophenols (4-nitrophenol, 2,4-dinitrophenol, 2-methyl-4,6-dinitrophenol) and five insecticides (acetamiprid, dinotefuran, thiacloprid, triflumuron, chlorfluazuron) in the Daecheong lake that is primary water resources for the central area in Korea including Daejeon. Furthermore, the effect of land use type and monthly precipitation on the concentration trends of nitrophenols and insecticides were assessed.
Methods
River water samples were obtained for once in a month for five months (June to October in 2016) in seven sites of the Daecheong lake. All residues were analyzed by LC-ESI/MSMS after extraction using solid phase extraction cartridge. Method detection limit (MDL) of nitrophenols and insecticides were 0.4-1.2 ng/L and 0.2-5.0 ng/L, respectively. Average recoveries were 93.1% for nitrophenols (2,4,6-Tribromophenol), 68.7% and 41.3% for insecticides (Acetamiprid-d3, Thiacloprid-d4, respectively).
Results and Discussion
Detection frequencies (DF) and total concentrations of three nitrophenols were 71.4 to 100%, and not detected (ND) to 487 ng/L, respectively. Among insecticides, DF of neonicotinoids (acetamiprid, dinotefuran, thiacloprid) and benzoylureas (triflumuron, chlorfluazuron) ranged 28.6 to 100%, and 0 to 28.6%. Total concentrations of insecticides were ND to 253 ng/L. Total concentrations of all target compounds showed a significant difference between upstream and downstream, and adjacent lake by Mann-whitney U test. According to raising precipitation, an increasing pattern of three nitrophenols was revealed in tributaries and lakes but not observed three neonicotinoids in three lake sites. In June, dinotefuran was not detected at the Juwon upstream site with a forest land coverage, however the concentrations rapidly increased from July to August, followed by a sharp decrease in September. For the other four sites (Daecheong dam, Munui, Chudong, and Pumgok streams), dinotefuran concentrations increased by over 20 times between July and October.
Conclusions
In the Daecheong lake, which is used as a water supply source for over 3,470,000 personnel, three nitrophenol levels indicated 1,000 times lower than US EPA water quality criteria (WQC) unless high detection frequency (up to 70%). Similarly, there is only WQC among insecticides, acetamiprid showed under 1% of those of guideline. These results are acceptable as a drinking water supply source. To assess the correlation between characteristics of potential origin sources by land coverage and pollutant distributions, and relative monthly precipitation, it is indicated to be increased levels along with upstream surrounding with shrubland to downstream and adjacent lake covered with mixed land coverage (i.g. shrub, and human activities such as rice paddy, farm, transportation, and living). Besides, precipitation was higher as much as increasing concentration. It might be assumed that nitrophenols and insecticides spilled as non-target contamination sources with rainfall. Dinotefuran concentrations in Juwon upstream and three-site of lakes were massively increased in summer and autumn season considered as a pesticide spraying season for bug control such as Japanese pine sawyer, fruit moth, lace bug, and mites. These results implicated the possibility of using insecticides in a sanctuary where use of pesticides is prohibited.
1. 서 론
‘2017년 살충제 계란 파동’[1]과 같이 생활 환경 내 잔류하는 살충제 오염이 미치는 인체 위험을 방지하기 위한 식품 및 식수 관리의 중요성이 날로 강조되고 있다. 특히, 물은 동・식물뿐 아니라 인간생활과 활동, 더 나아가 국가의 안전보건 확보를 위한 필수요소로서 철저한 관리를 요구하는 재화이다. 국내에서는 살충제로 인한 먹는물의 오염방지를 위해 ‘농약에 의한 환경오염방지 업무처리지침’에 근거하여 규제 및 관리가 수행되고 있으며, 본 법령 제7조에 의거 상수원보호구역 내 수질오염성 농약을 포함한 항공방제용 농약 사용 금지를 규정하고 있다[2]. 하지만 농약 허용물질목록 제도(Positive List System, PLS)에 등록된 농산물 대상 농약 잔류허용기준(Maximum residue limit, MRL)을 둔 화학물질수가 509개[3]인데 반해 수질의 농약 MRL은 14개에 그쳐[4] 수환경오염에 대한 규제와 연구가 상대적으로 부족하다.
미국에서 살충제 용도로 처음 사용한 니트로페놀류는5) 1987년 미국에서 11,500톤 이상 사용되었으며 호흡이나 음식물 섭취를 통해 노출된 경우 두통, 졸음, 메스꺼움 및 청색증 등 인체 영향 발생이 보고되어 관련 물질의 위험성이 알려졌다[6]. 이후 연구를 통해 미환경청(United States Environmental Protection Agency, US EPA)은 음용수나 강물에 미량이 존재하더라도 수중 생물과 인간에게 피해를 주는 상위오염물질(Priority pollutants)로 지정[7]함과 동시에 먹는물 수질기준은 2,4-dinitrophenol 70 µg/L, 4-nitrophenol 13 µg/L, 2-methyl-4,6-dinitrophenol 60 µg/L 이하로 규정했다[8]. 최근 국내에서 소나무의 재선충병과 각종 과채 나무의 해충을 예방하기 위해 사용하는 네오니코티노이드계(Neonicotinoid) (e.g. thiacloprid, acetamiprid, dinotefuran)가 기존 살충제의 대체재로서 사용되고 있다. 그러나 US EPA에서 보고된 살충제 독성 자료에 의하면 thiacloprid는 경도 독성을 나타내고[9], dinotefuran는 경미한 급성 독성 수준을 나타내는 것으로 알려졌다[10]. 특히, acetamiprid는 인체에 경미한 급성 및 만성 독성을 야기 시킬 가능성이 있으며 US EPA에서는 식수안전기준 497 µg/L 이하로 관리하도록 지정하였다[11]. 또한, 재선충제로 사용되는 다른 계열의 살충제 중 벤조일우레아계(Benzoylurea)에 속하는 triflumuron, chlorfluazuron은 미국식품의약국(Food and Drug Administration, FDA) 살충제 모니터링 프로그램에서 급성 독성에 대한 잠재적인 가능성이 있어 지속적인 모니터링을 요구한다[12].
그러나 국내의 경우 살충제류 5종(acetamiprid, dinotefuran, thiacloprid, triflumuron, chlorfluazuron)의 음용수 MRL이 설정되지 않았으며, 본 물질을 대상으로 진행된 연구는 2016년 금강을 대상으로 진행한 단 한 건의 연구(ND-80.2 ng/L) [13]에 불과하여 국내 수계 내 분포 수준을 파악하기에 부족한 실정이다. 니트로페놀류 3종(2,4-dinitriphenol, 2-methyl-4,6-dinitrophenol, 4-nitrophenol)의 경우도 음용수 MRL이 설정되지 않았고, 2013년 이후 국내 주요 수계에서 지속적으로 검출(한강: ND-1.33 µg/L [14]; 낙동강: ND-451 ng/L [15]; 금호강 15.5-68.6 ng/L [16])되고 있어 주기적인 모니터링이 필요하다.
국내에서 두 번째로 큰 상수원 보호구역인 대청호는 세종특별자치시, 대전광역시, 충청남・북도 22개 시군, 전라북도 13개 시군, 경상북도 상주시, 경기도 안성시 등 다양한 권역의 상수원으로 사용하고 있으며[17], 1990년 4월 환경부에서 유역 내 취수장 상류지역을 ‘특정수질유해물질배출시설설치제한지역’으로 고시하였다[18]. 그러나 유역면적대비 저수량이 많아 물의 정체기간이 길고 소규모의 농업과 축산업으로 인해 발생되는 비점오염원의 원인으로 부영양화 현상이 매년 발생하는 것으로 보고되어[19] 살충제와 같은 환경오염물질 유출 위험에 노출되어 관리가 필수적이다[20]. 따라서 본 연구는 상수원수로 사용되는 대청호 수역을 대상으로 니트로페놀류 3종(4-nitrophenol, 2,4-dinitriphenol, 2-methyl-4,6-dinitrophenol) 및 살충제류 5종(acetamiprid, dinotefuran, thiacloprid, triflumuron, chlorfluazuron)을 모니터링하여 노출 빈도 및 농도 수준 확인과 강우 및 지역 특성에 따른 거동을 파악하고자 하였다.
2. 재료 및 방법
2.1. 조사대상물질
본 연구에서는 니트로페놀류 3종(4-nitrophenol, 2,4-dinitrophenol, 2-methyl-4,6-dinitrophenol)과 살충제류 5종(acetamiprid, dinotefuran, thiacloprid, triflumuron, chlorfluazuron)을 조사하였다.
2.2. 시약 및 기기
본 연구에 사용된 모든 시약은 대상물질의 분석 시 영향을 미치지 않는 것을 사용하였다. 아황산나트륨(Sodium sulfite, anhydrous)은 Sigma Aldrich사(St. Louis, MO, USA)의 특급시약을 사용하였다. 메탄올(Methanol) 및 아세토니트릴(Acetonitrile)은 J.T Baker사(Philipsberg, USA)의 HPLC급을 사용하였고, 아세트산(Acetic acid)는 Waco사(Tokyo, Japan)의 특급 시약을 사용하였다. 초순수(HPLC Water)는 Honeywell사(Morris, USA)의 HPLC급을 사용하였다. 시료의 정제 및 추출을 위한 고체상 추출장치는 Supelco사(Bellefonte In, PA, USA)의 VisiprepTM SPE Vaccum manifold를 이용하였다. 페놀류 분석에 사용한 HLB 카트리지(200 mg, 6 cc)는 Waters사(MA, USA)의 제품을 사용하였고, 살충제류 분석에 사용한 C18 카트리지는 Supelco사(Bellefonte In, PA, USA)의 제품을 사용하였다. 니트로페놀류의 정제용 표준물질과 정량용 내부표준물질, 실린지 첨가용 내부표준물질은 모두 Accustandard사(New Heaven, USA) 제품을 이용하였고, 살충제류의 정량용 내부 표준 물질 중 Thiacloprid-d4는 CDN사(Langley, B.C., Canada)의 제품을 이용하였다. 그 외 정량에 필요한 살충제류 물질은 모두 Siama aldrich사(St. Louis, MO, USA)의 제품을 사용하였다. 니트로페놀류 및 살충제류의 기기분석은 모두 액체크로마토그래프-텐덤질량분석기(LC-ESI/MS/MS, 6460 MSD, Agilent, Santa Clara, USA)를 이용하였다.
2.3. 시료 채취
상수원 내 살충제로 알려진 총 8종의 화학오염물질의 농도 수준 모니터링을 위해 2015년 6월부터 10월까지 5개월간 매월 1회 대청호 수역 내 7개 지점에서 담수를 채수하여 총 35개의 시료를 분석하였다. 7개 시료 채취 지점은 호소 3개소와 하천 4개소이며, 대전취수탑이 위치한 추동(C)과 청주 취수탑이 있는 문의(M), 추동과 문의 합류점인 댐앞(D), 추동으로 합류되는 주원천의 상류(JW-U)와 하류(JW-D), 문의로 합류되는 품곡천의 상류(PG-U)와 하류(PG-D)로 이루어졌다. 상류와 하류의 구분은 국립환경과학원 금강물환경연구소 조사에 근거하여 토지 피복 특성에 따라 분류하였는데, 산림 위주의 단일 피복지를 상류로 설정하고, 논과 밭, 교통 등의 다양한 영향을 받는 지점을 하류로 선정하였다. 선정된 모든 시료 채취 지점의 위치와 수계 흐름은 Fig. 1에 도식화하였다.
(a) Satellite picture and (b) Schematic diagram of the studied sampling location. (D: Daecheong Dam; M: Munui; PG-U: Pumgok upstream; PG-D: Pumgok downstream; C: Chudong; JW-U: Juwon upstream; JW-D: Juwon downstream)
2.4. 분석 방법
담수시료는 단순채취(Grab sampling) 방식을 사용하여 해당 지점에서 2 L 이상의 시료를 채수 후 분석 전까지 -20℃에서 냉동 보관하였으며, 분석 직전 유리 섬유 여과지(GF/F, 0.47 µm)를 이용하여 부유물질을 제거한 후 분석하였다.
2.4.1. 니트로페놀류
시료 500 mL에 정량용 내부표준물질(2,4,6-Tribromophenol) 40 ng과 염(鹽) 제거용 아황산나트륨 20-30 mg을 주입 후 HLB 카트리지(Oasis HLB 6 cc, 200 mg)를 이용하여 추출 정제하였다. 카트리지의 추출 효율을 위해 메탄올 및 초순수 각 6 mL로 카트리지를 활성화 시킨 후 시료를 흘려주었다. 이후 카트리지의 수분을 제거하기 위해 약 30분간 건조시키고 12 mL의 메탄올로 분석대상물질을 용출시켰다. 용출액은 질소가스(Purity, 99.999%)를 이용하여 약 1 mL 이하로 농축한 다음 실린지 첨가용 내부표준물질(2,3,4,5-Tetrachlorophenol) 40 ng을 주입 후 메탄올을 이용하여 최종 부피 1 mL로 만들어 LC-ESI/MS/MS를 이용하여 분석하였으며 기기 분석조건은 다음과 같다(Table 1).
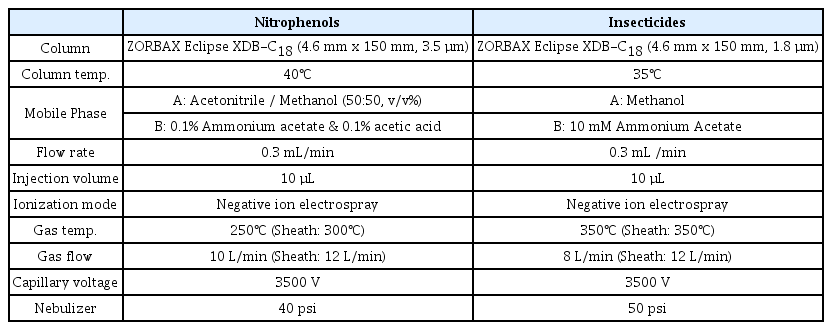
LC-ESI/MSMS instrument analysis condition.
2.4.2. 살충제류
시료 500 mL에 정량용 내부표준물질(Acetamiprid-d3, Thiacloprid-d4) 200 ng을 주입 후 C18 카트리지를 이용하여 추출 및 정제를 하였다. 카트리지를 메탄올과 초순수 각 6 mL로 활성화한 후 시료를 흘려주었고, 곧바로 초순수 6 mL을 카트리지 내부에 흘려주어 남아 있는 분석대상물질을 세척하였다. 이후 수분을 제거하기 위해 약 30분간 건조시킨 후 1%의 아세트산이 첨가된 메탄올과 아세토니트릴 1:1 (v:v) 혼합용액 12 mL로 분석대상물질을 용출시켰다. 이후 질소가스를 이용하여 약 1 mL 이하로 농축 시킨 다음 실린지 첨가용 내부표준물질(Atazine-d5) 200 ng을 주입 후 메탄올을 이용하여 최종 부피 1 mL로 맞춘 뒤 LC-ESI/MS/MS를 이용하여 분석하였다(Table 1).
2.5. 정도관리
검출한계(Method detection limit, MDL)는 신호 대 잡음비(S/N ratio) 3으로 정의하였으며 이를 적용한 결과 니트로페놀류의 검출한계는 0.4-1.2 ng/L (2,4-dinitrophenol: 1.2 ng/L; 4-nitrophenol: 1.0 ng/L; 2-methyl-4,6-dinitrophenol: 0.4 ng/L), 살충제류의 경우 0.2-5.0 ng/L (acetamiprid: 0.4 ng/L; chlorfluazuron: 1.8 ng/L; dinotefuran: 5.0 ng/L; thiacloprid: 0.2 ng/L; triflumuron: 0.3 ng/L)이었다. 내부표준물질에 대한 회수율은 니트로페놀류(2,4,6-Tribromophenol)는 80.2-119% (평균 93.1%), 살충제류는 Acetamiprid-d3은 43.1-125% (68.7%), Thiacloprid-d4는 21.7-88.1% (41.3%)의 범위로 나타났다. 검량곡선은 정량 범위 내 5개 이상 농도에 대해 작성하였고, 검량선 결정계수(R2)는 0.99 이상을 만족하였다. 기기 분석이 시작된 후 매 12시간마다 중간 농도의 표준물질을 주입하여 검정곡선의 직선성을 검증하였으며 처음 작성된 검량선의 평균값과 비교하여 20% 미만의 변화를 보였다.
2.6. 통계분석
모든 통계분석은 SPSS 23.0 (IBM Inc, USA)을 이용하여 수행하였다.
3. 결과 및 고찰
3.1. 니트로페놀류
3.1.1. 물질별 농도 수준
금강 내 상수원 인근의 7개 지점에서 얻어진 니트로페놀류(3종)의 조사시기별 검출빈도와 농도 수준을 Table 2에 나타냈다. 목재방부제와 살충제로 사용되고, 인체에 노출될 경우 혈액, 뇨(尿), 피부조직 등에서 검출되는 것으로 알려진 2,4-dinitrophenol은[21] 본 연구에서 ND (Not detected)-181 ng/L (평균 45.6 ng/L)의 농도 수준으로 검출되었다. 본 조사결과는 2,858 km 규모의 유럽에서 가장 긴 강인 다뉴브강을 대상으로 2007년 조사된 대규모 스크리닝 연구결과(19 ng/L) [22]보다 다소 높은 수준이었다. 국내의 경우 4대강 준설 사업이 수행되었던 2011년 낙동강에서 225 ng/L 수준으로 본 연구보다 높게 검출되었고[23], 금호강, 형산강 등 다른 수계에서는 본 연구와 비슷하거나 약간 낮은 수준의 농도로 조사되었다(Table 3). 살충제로 알려졌으며 인체 노출시 뇨(尿)로 배출된다고 알려진6) 4-nitrophenol의 농도 수준은 ND-264 ng/L (평균 33.2 ng/L)로 조사되었다. 본 결과는 다뉴브강(29 ng/L)보다 다소 높았으나[22], 2011년 낙동강 결과보다 낮은 수준(155 ng/L) [15]이고, 이 외 국내 선행연구와 비슷한 수준으로 조사되었다(Table 3). 2-methyl-4,6-dinitrophenol은 ND-126 ng/L (평균 29.0 ng/L) 수준으로 나타났다. 이는 2011년 낙동강 선행연구보다 낮은 수준(116 ng/L) [15]이며, 이 외 국내 선행연구와 비슷한 수준으로 조사되었다(Table 3). 본 연구의 니트로페놀류 검출빈도는 대상물질 3종 모두 70% 이상으로 높은 검출 빈도를 보였으나, US EPA WQC (Water Quality Criteria) 기준(2,4-dinitrophenol: 70 µg/L; 4-nitrophenol: 13 µg/L; 2-methyl-4,6-dinitrophenol: 60 µg/L)보다 대략 1,000배 가량 낮아 식수로써 안전한 상태로 판단된다[8].
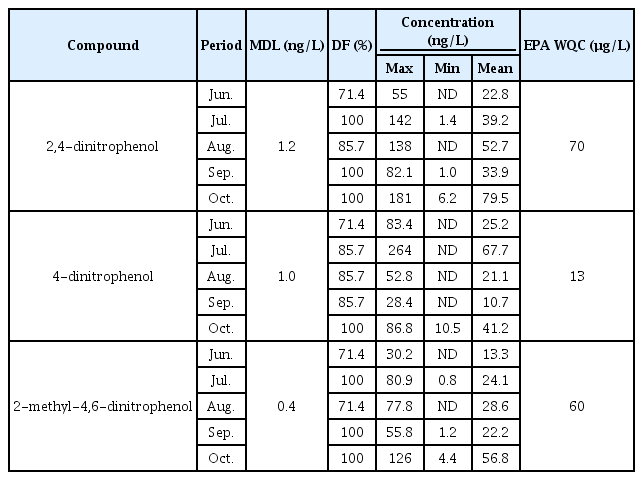
MDL, DF and concentration of three nitrophenols in water during sampling campaign.
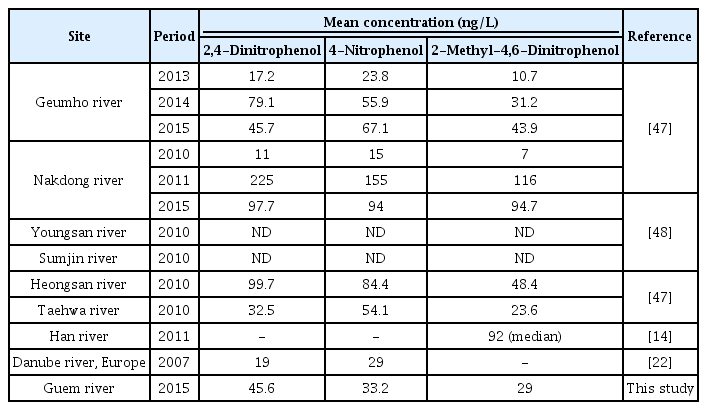
Comparison of three nitrophenol concentration with previous researches.
3.1.2. 지점별 농도 수준 및 분포 경향
3종 니트로페놀류의 총농도는 ND-487 ng/L 수준으로 나타났다. 지점별 평균 농도를 비교하면 추동(C)(평균 285 ng/L), 문의(M) (222 ng/L), 댐앞(D) (176 ng/L), 주원천 하류(JW-D) (26.1 ng/L), 품곡천 하류(PG-D) (24.6 ng/L), 주원천 상류(JW-U) (11.5 ng/L), 품곡천 상류(PG-U) (7.5 ng/L) 순이었으며, 하천의 상류에서 하류 및 호소로 갈수록 니트로페놀류의 농도가 높게 검출되었다.
본 연구결과에서 얻은 지점간의 농도 차이를 Mann-whitney U-test을 적용한 통계적 검증을 통해 문의(M)와 품곡천 상・하류(PG-U,D), 추동(C)과 주원천 상・하류(JW-U,D)간 유의한 차이가 있는 것으로 나타났다(p<0.05) (Fig. 2). 반면, 호소 지점인 문의(M), 추동(C)과 호소의 합류부인 댐앞(D)간에는 유의한 차이가 나타나지 않았다. 본 연구에서 얻은 니트로페놀류의 농도 분포는 국립환경과학원 낙동강유역환경청 낙동강수질측정망에서 총 5종의 페놀류(2,4-dimethylphenol, 3-methyl-4-chlorophenol, 2,4-dinitrophenol, 4-nitrophenol, 2-methyl-4,6-dinitrophenol) 대상 선행연구에서 하류로 갈수록 농도가 증가하는 경향과 유사하였다[15]. 이는 니트로페놀류가 산림이나 인근 농가 등의 비점오염원에서 유입되어 하천 하류 및 호소로 갈수록 농도가 높아진 것으로 추정된다.

The total concentrations of three nitrophenol in each site. (D: Daecheong Dam; M: Munui; PG-U: Pumgok upstream; PG-D: Pumgok downstream; C: Chudong; JW-U: Juwon upstream; JW-D: Juwon downstream)
3.1.3. 강우량에 따른 농도 변화
니트로페놀류는 산업단지나 하수처리장을 통해 유출된 폐수[24], 농약류 부산물[25], 자동차 배기가스[26] 등 다양한 요인에 의해 기인하며, 집중적 강우는 하천의 농경지, 축사 등의 집적된 유기오염물질을 수계로 유입시켜 농도를 증가시키는 주원인으로 알려져 있다[27]. 이를 통해 강우에 의해 증가된 유량과 토지 피복 특성에 따른 니트로페놀 오염의 상관성을 파악하고자 2015년 6월부터 10월까지 매 1회, 7개 지점의 채수시료에서 검출된 니트로페놀 3종의 농도와 강수량을 비모수 통계분석 방법인 spearman 상관 계수를 이용하여 비교하였다(Fig. 3).

Comparison with concentration variation of 3 nitrophenol and monthly precipitation from sampling position. (ρ: spearman’s rank correlation coefficient; p: significance probability). (a-1. tributaries-2,4-dinitrophenol; a-2. lake-2,4-dinitrophenol; b-1. tributaries-4-nitropenol; b-2. lake-4-nitrophenol; c-1. tributaries-2-methyl-4,6-dinitrophenol; c-2. lake-2-methyl-4,6-dinitrophenol). (D: Daecheong Dam; M: Munui; PG-U: Pumgok upstream; PG-D: Pumgok downstream; C: Chudong; JW-U: Juwon upstream; JW-D: Juwon downstream)
기상정보개방포털을 통해 전반적 시료채취 지역에 속하는 청주의 월간 강수량은 7월(141.4 mm), 10월(90.5 mm), 6월(83.3 mm), 8월(54.3 mm), 9월(20.1 mm) 순으로 나타났다[28]. 국립환경과학원 금강물환경연구소에서 조사된 샘플링지점에 토지 피복 특성[29]에 근거한 산림 위주 단일 피복 지역인 하천 상류 중 품곡천 상류(PG-U)에서 모든 니트로페놀이 강우량이 증가함에 따라 농도가 증가하였다(Fig. 3(a-1), (b-1), (c-1)). 논과 밭, 교통 등 복합 토지 피복 지역인 하천 하류는 전 지점(주원천 하류(JW-D), 품곡천 하류(PG-D))에서 니트로페놀 3종 모두 양의 상관관계를 보였다(Fig. 3(a-1), (b-1), (c-1)). 호소의 경우 추동(C)에서 모든 니트로페놀이 양의 상관관계를 나타냈으며, 특히 대상물질 중 4-nitrophenol은 호소 전 지점(댐(D), 문의(M), 추동(C))에서 높은 양의 상관관계를 보였다(Fig. 3(a-2), (b-2), (c-2)). 본 결과는 강수량 증가가 수계 내 니트로페놀류 농도 증가에 영향을 미치는 것을 시사한다.
3.2. 살충제류
3.2.1. 물질별 농도 수준
금강 내 상수원 인근의 7개 지점에서 얻어진 살충제류(5종)의 조사시기별 검출빈도와 농도수준을 Table 4에 정리하였으며 선행연구결과는 Table 5에 나타냈다. Acetamiprid는 인체에 낮은 유해성으로 알려진 살충제로[30] 본 연구에서 ND-57.6 ng/L(평균 5.9 ng/L) 수준으로 검출되었으며, US EPA에서 제안한 식수안전기준(497 µg/L 이하)의 약 1% 미만 수준으로 나타났다[11]. 선행 연구결과와 비교 시 미국 텍사스(2,200 ng/L) [31]와 호주 시드니(80 ng/L) [32]보다 낮은 농도 수준을 나타내며, 일본 오사카(1.4 ng/L) [33]와 브라질의 마토 그로소(ND) [34], 미국 아이오와(ND) [35]보다 높은 수준이었다. 국내의 경우 2016년 금강 연구(5.7 ng/L) [13]와 비슷한 수준으로 검출되었다. Dinotefuran은 범용적으로 사용하는 네오니코티노이드계 살충제로써 본 연구에서 ND-251 ng/L (48.2 ng/L)로 조사되었다. 이는 일본 오사카(19 ng/L) [33]와 미국 아이오와(ND) [35], 2016년 국내 금강 연구결과(22.8 ng/L) [13]보다 다소 높은 수준으로 검출되었다. 호흡기를 통한 흡입으로 급성 독성이 야기되어 야외 및 주거 제외 지역에서만 제한적으로 사용하도록 권고되는[9] 네오니코티노이드계 살충제인 thiacloprid는 본 연구에서 ND-12.4 ng/L (3.1 ng/L)로 조사되었다. 호주 시드니(150 ng/L) [32]보다 낮은 농도 수준을 보였으며, 브라질의 마토 그로소(ND) [34], 미국 아이오와(ND) [35], 2016년 금강(2.1 ng/L) [13]보다 다소 높거나 비슷한 수준으로 검출되었다. 소나무 재선충제로 사용 되는 벤조일우례아계 살충제로 알려진 triflumuron, chlorfluazuron은 7월에 제한적으로 주원천 상류(triflumuron 2.5 ng/L; chlofluazuron 9.5 ng/L), 품곡천 하류(triflumuron 0.3 ng/L)에서 단 한 차례 검출되었고, 그 외 다른 시기는 불검출(ND)되었다. 본 물질을 대상 국내・외 선행연구는 전무하여 비교 불가능하였다.
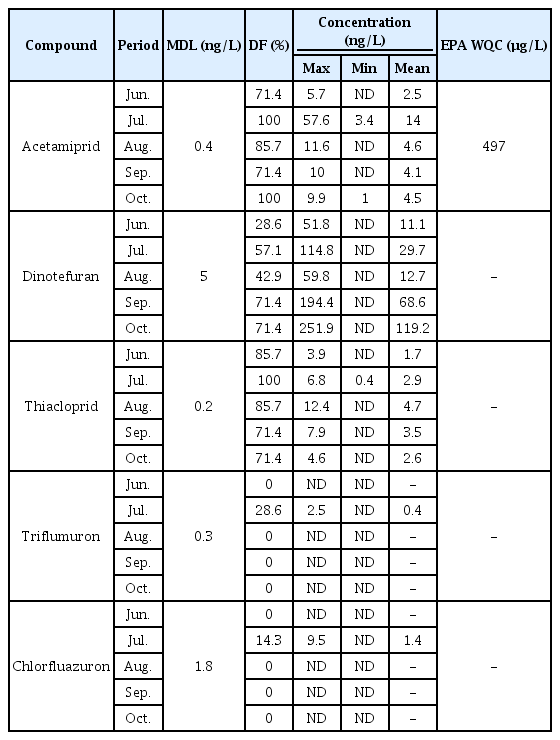
MDL, DF and concentration of five insecticides in water during sampling campaign.
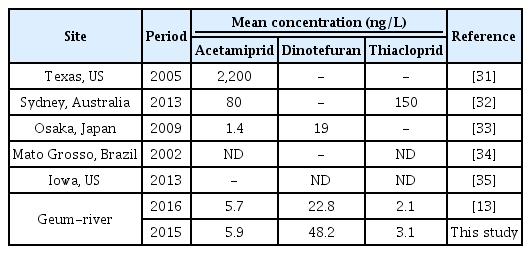
Comparison of three insecticide concentration with previous researches.
본 연구에서 조사된 5종 살충제류 중 acetamiprid와 thiacloprid는 70% 이상 높은 검출빈도를 보였으며, dinotefuran은 6월과 8월을 제외한 나머지 기간 동안 50% 이상 높은 검출빈도를 보였다. 반면 벤조일우례아계 살충제인 triflumuron과 chlorfluazuron은 6월에 한해 단 2개 지점에서만 검출되었으며, 이 외 다른 조사기간에서 검출되지 않았다. 이와 같은 경향은 물질의 사용량뿐만 아니라 물질 특성과 밀접한 관련이 있는 것으로 추정된다. 네오니코티노이드계 살충제류 3종(acetamiprid, dinotefuran, thiacloprid)은 높은 수용해도(acetamiprid: 4,250 mg/L [36]; dinotefuran: 54,300 mg/L [37]; thiacloprid: 185 mg/L [38]와 친수성(log Kow acetamiprid: 0.8 [36]; dinotefuran: -0.6 [37]; thiacloprid: 1.3 [38]을 지녀 수계 내 살포될 경우 높은 검출빈도를 보일 가능성이 높다. 반면, 벤조일우례아계인 triflumuron과 chlorfluazuron은 수용해도(chlorfluazuron: 0.016 mg/L [39]; triflumuron: 0.025 mg/L [40])가 매우 낮고 소수성(log Kow chlorfluazuron: 5.8 [39]; triflumuron: 4.9 [40])을 나타내 살포되었더라도 물에 용해될 가능성이 현저히 낮아 검출수준 및 빈도가 저평가될 가능성이 있다.
3.2.2. 지점별 농도 수준 및 분포 경향
본 연구에서 선정한 살충제류 5종의 지점별 총농도는 ND - 253 ng/L 범위로 나타났으며, 각 지점별 검출된 평균 수준은 품곡천 하류(PG-D) (평균 99.9 ng/L), 추동(C) (81.3 ng/L), 댐앞 (D) (65.6 ng/L), 주원천 하류(JW-D) (65.5 ng/L), 문의(M) (55.3 ng/L), 주원천 상류(JW-U) (31.5 ng/L), 품곡천 상류(PG-U) (1.62 ng/L) 순으로 나타났다. 대청호 내 취수탑 인근 하천인 품곡천과 주원천에서 상류(PG, JW-U)에서 하류(PG, JW-D)로 갈수록 농도가 증가하는 경향을 보였다(Fig. 4). Mann-whitney U-test에서는 품곡천 상류(PG-U)와 문의(M), 주원천 상류(JW-U)와 추동(C)간에 유의한 차이(p<0.05)가 나타났는데 살충제류가 사용된 이후 강우와 같은 비점오염원의 형태로 유입된 후 하류 부근에 집적된 것으로 파악된다[41].
The total concentrations of five insecticide in each site. (D: Daecheong Dam; M: Munui; PG-U: Pumgok upstream; PG-D: Pumgok downstream; C: Chudong; JW-U: Juwon upstream; JW-D: Juwon downstream)
3.2.3. 강우량에 따른 농도 변화
본 연구에서 선정한 살충제류에 속하는 그룹 중 검출빈도가 50% 이상인 thiacloprid, acetamiprid, dinotefuran 3종을 대상으로 월별 강우량과 비교하였다. 네오니코티노이드계에 속하는 thiacloprid, acetamiprid, dinotefuran의 수계 유입 경로는 눈과 비를 통해 유입되거나, 농약 제조 공장이나 농작지에서 사용된 농약이 지하수 및 대기를 통해 유입되는 것으로 조사되었다[24,42]. 3.1.3에 기술한 청주 지역의 월별 강우량과 3종 살충제류 농도 비교를 통해 하천 상류 중 품곡천 상류(PG_U)에서 acetamiprid, thiacloprid가 양의 상관관계를 보였다(Fig. 5(a-1), (c-1)). 하천 하류 중 품곡천 하류(PG_U)는 acetamiprid와 thiacloprid가 양의 상관관계를 보였고(Fig. 5(a-1), (c-1)), 주원천 하류(JW_D)는 acetamiprid와 dinotefuran이 양의 상관관계를 보였다(Fig. 5(a-1), (b-1)). 그러나 위와 같이 일부 하천에서 강수량과 살충제 농도 간 유의한 양의 상관관계를 보였으나, 본류 지점은 전반적으로 동일한 경향성이 나타나지 않았다.

Comparison with concentration variation of each target insecticide and monthly precipitation from sampling position. (ρ: spearman’s rank correlation coefficient; p: significance probability) (a-1. Lake-acetamiprid; a-2. Tributaries-acetamiprid; b-1. Lake-dinotefuran; b-2. Tributaries-dinotefuran; c-1. Lake-thiacloprid; c-2. Tributaries-thiacloprid). (D: Daecheong Dam; M: Munui; PG-U: Pumgok upstream; PG-D: Pumgok downstream; C: Chudong; JW-U: Juwon upstream; JW-D: Juwon downstream)
강우량과 관계는 없으나 월별 검출된 농도 변화를 통해 산림 위주 단일피복 지점인 주원천 상류에서 6월에 검출되지 않았던 dinotefuran이 7-8월부터 증가하는 추세(7월: 34.5 ng/L; 8월: 59.8 ng/L)를 보이다 8-9월 다시 감소하는 결과(8월: 59.8 ng/L; 9월: 32.9 ng/L)를 보였다. 본 결과는 소나무 재선충 매개역할을 하는 솔수염하늘소의 산란시기(6월-9월)와[43] 일치하고, 산림 위주의 토지 단일 피복 특성을 미루어 직접적인 살포가 있었음을 암시한다. 더불어, 본류 지점(댐앞, 문의, 추동) 및 품곡천 하류(PG-D)의 dinotefuran의 농도가 7월 기준 대비 10월에 약 20배 이상(호소 3개 지점 평균: 7월 8.7 ng/L; 10월 185 ng/L) 급격히 높게 검출되었다. 2016년 3월부터 12월까지 연구된 선행연구에서 2015년 본 결과 대비 증가 폭이 크진 않으나(호소 3개 지점 평균: 7월 9.7 ng/L; 10월 21.4 ng/L) [13] 가을철 농도가 증가하는 유사한 경향을 보였다. 이는 9-10월 철쭉에 주로 발생하는 심식충, 방패벌레, 응애류 등 병충해 방지를 위한 dinotefuran 살포 시기와 유사하여[44,45] 살균제 사용이 금지된 ‘상수원보호구역’ [46] 내에서 본 물질의 농도가 증가한 원인 파악을 위한 추가 조사가 필요할 것으로 판단된다.
4. 결 론
본 연구는 국내에서 두번째로 큰 상수원인 대청호를 대상으로 니트로페놀류 3종(2,4-dinitrophenol, 4-nitrophenol, 2-methyl-4,6-dinitrophenol)과 살충제류 5종(acetamiprid, dinotefuran, thiacloprid, triflumuron, chlorfluazuron)의 노출 실태를 파악하고 강우에 의한 농도 변화를 파악하고자 2015년 6월부터 10월까지 총 7개소를 선정하여 매달 대상물질의 농도 수준을 조사하였다.
1) 니트로페놀류 농도는 ND-487 ng/L(검출빈도: 70% 이상)로 국내 낙동강 대상 선행연구와 비슷하거나 다소 높은 수준이었으나 EPA WQC 기준의 약 1,000배 이하 수준으로 조사되었다. 살충제류 농도 수준은 ND-253 ng/L(네오니코티노이드계: 70% 이상; 벤조일우례아계: 5% 미만)로 조사되었으며, 미국 텍사스 및 호주 시드니보다 낮은 수준, 브라질의 마토 그로소, 미국 아이오와보다 약간 높은 수준으로 파악되었으나, US EPA 식수안전기준이 존재하는 acetamiprid 기준치의 약 1% 미만 수준으로 나타났다.
2) 조사 기간에 따른 지점별 농도 변화와 강우량 비교를 통해 하천 품곡천 상류와 품곡천 및 주원천 하류 내 대상물질의 농도 변화는 대다수 강우량과 유사한 거동을 나타내었고, 특히 4-nitrophenol는 주원천 상류를 제외한 시료 채취 전 지점에서 뚜렷한 양의 상관관계가 나타났다. 더불어, 강수량과 관계없이 7-9월 주원천 상류 및 9-10월 호소 3개소에서 dinotefuran의 농도 수준이 급격히 상승한 결과가 나타났는데 이 시기는 소나무와 철쭉에 발생되는 병충해 방지 살충제류 살포시기와 유사하였다. 따라서 살충제 사용이 금지된 ‘상수원보호구역’에서 일부 살충제 물질의 농도 증가에 대한 명확한 원인 규명을 위해 추가적인 조사가 필요하다고 판단된다.
Acknowledgements
본 연구는 금강 수계 관리 위원회의 연구비 지원으로 수행되었습니다(과제번호: NIER-RP2015-339). 이에 감사드립니다.