


1. Introduction
The word ‘Noise’ named from Latin word ‘nausea’ which means unwanted sound or sound that is loud or unpleasant or may be unexpected [1]. Our ears cannot filter unwanted sound and it causes damage of our ear drums and loss of hearing. The sound produced in the environment that is above the limit of human normal hearing is called noise pollution [2]. Noise pollution may not directly or immediately effect human being. This pollution physiologically and psychologically effects humans gradually and in the long term it has impacts on the human general health, human nervous system, and hearing loss [3]. Noise is addressed as a silent killer because of its enormous health hazards. It is more damaging than many people could realize [4]. Noise pollution has become a global issue due to globalization, rapid development activities, transportation, and industrialization [5]. European Union estimated that 80 million peoples are suffering from noise levels that are unacceptable and 170 million peoples are experiencing serious annoyance during daytime [6]. Minimum 10,000 premature deaths occur every year due to environmental noise [7,8]. After air and water pollution, noise pollution is considered to the third most hazardous type of pollution according to world health organization (WHO) [9,10]. Noise can affect human health in several ways such as sleep disturbance, annoyance reaction, mental sickness, hearing loss etc [11].
Noise pollution is becoming a potential nuisance in the urban areas of many Asian countries because of rapid population growth and urbanization [12,13]. Noise pollution is a major problem for urban areas in many developing countries like Bangladesh. Although, advanced research has been performed for noise mapping in different cities of developed countries [14], a very few studies were conducted for developing countries [15-19]. Chittagong is a metropolitan city of Bangladesh which has more than 5 million people and the population is constantly growing [20]. The inhabitants of Chittagong City are exposed to high level of noise pollution following persecuted by air and water pollution [21]. Noise pollution is becoming a major concern of this city because of establishing industries near the residential areas and huge traffic volume.
In Bangladesh, the evaluation of noise level and associated risk have attracted attention in recent years due to their concerning impacts. It is appeared that the noise level of different commercial and traffic areas in the Dhaka City exceeded the Department of Environment (DOE) standard. A study by Hoque, Islam, Kabir [22] showed that the average noise level varied between 78.3-86.5 dB(A). In another study, it was evaluated that the noise pollution at different zones of Sylhet City ranging from 73.0-85.0 dB(A) exceeded the recommended limit (65 dB(A)). They argued that the people were suffering multiple physiological and psychological diseases due to noise pollution [12]. Satter, Saju [23] showed the Khulna City traffic noise data of five locations of different road intersection. They found the maximum noise level was 87.0 dB(A) while the minimum noise level was 79.0 dB(A). Almost all the data went beyond the national standard (70 dB(A)) at all monitoring locations [23]. In another study T. K. Das et al. (2018) found the noise levels of five different zones (i.e., educational, traffic, commercial, residential and hospitals) in Magura Municipality, Bangladesh were exceeding the national and international standards. All the noise level data were measured above 90.0 dB(A) in the Magura Municipality [16].
Uddin, Hoque, Islam [10] measured the noise pollution levels in the Chittagong City at eight different places during working days from 6:00 am to 9:00 pm and a maximum sound level of 112.0 dB(A) was found at New Market and 2 No gate traffic area while a minimum sound level of 67.0 dB(A) was obtained at GEC traffic area. Despite several studies were conducted in the Chittagong region [2,10,21,24] and other large cities Dhaka, Sylhet, Khulna, Magura, Tangail [12,16,22,25-27] of Bangladesh but no comprehensive study has been done on Chittagong based on noise mapping to date. Only one such study for Dhaka City was conducted which illustrated noise mapping [28]. As the mapping of noise pollution is the most important tools to control noise pollution in the environment [29], therefore the survey of noise mapping of different zones in Chittagong City is necessary [24,30]. As noise has different spatial components, using of geographic information system (GIS) with advanced interpolation techniques for mapping could provide appropriate platform for its mitigation and can be used in decision making process.
Table 1, showed the noise quality standard set by Department of Environment, Bangladesh (2006). They counted the day time from 6 am to 9 pm and the night time from 9 pm to 6 am. They suggested Area up to a radius of 100 meters around hospitals or educational institutions or special institutions/establishments identified by the Government is designated as Silent Zones where use of horns of vehicles or other audio signals, and loudspeakers are prohibited. They only suggested rules of noise pollution controls but no specific evaluation method is described.
The main objective of this study is to determine the noise level of twelve areas of the Chittagong City that are categorized into three zones i.e., residential zone, commercial zone and silence zone in the period of morning, noon, and evening and to develop GIS mapping for that areas according to their noise levels so that most vulnerable areas can be identified in Chittagong City.
2. Methods
2.1. Study area
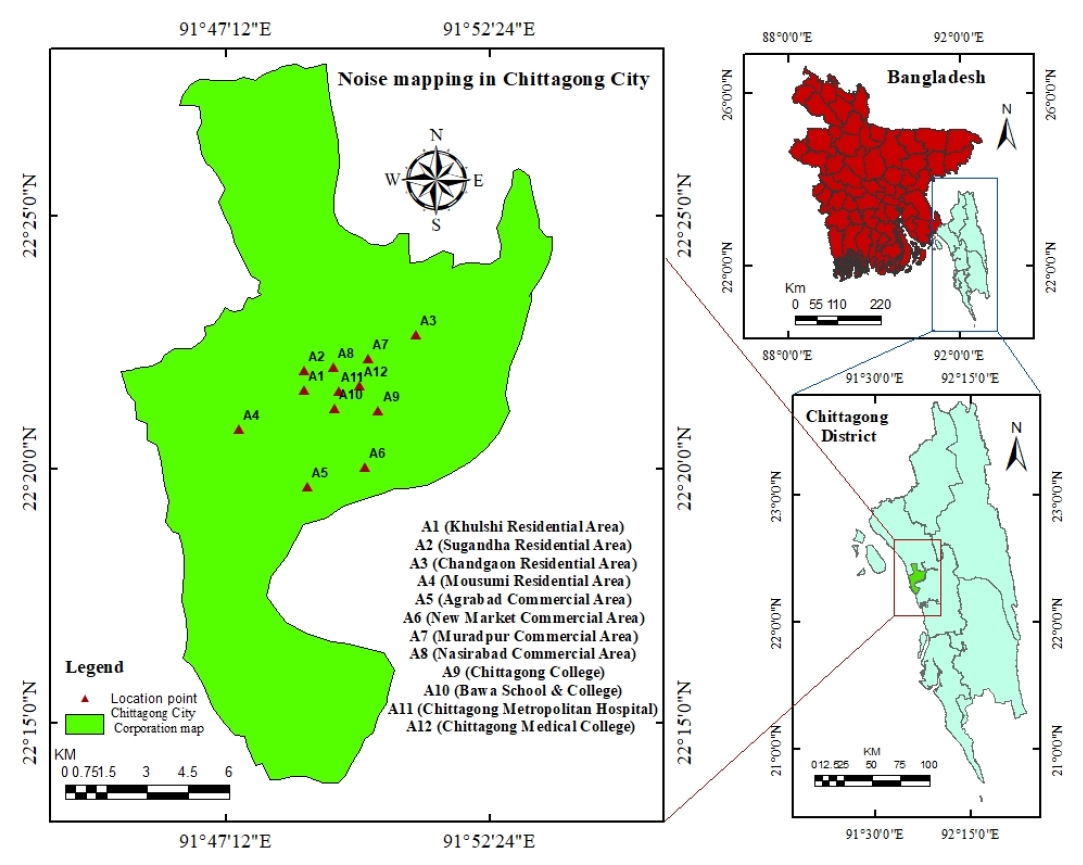
Chittagong is the port city of Bangladesh which also a metropolitan city of the district Chittagong, Bangladesh. It is the second largest city which is located in the southeastern part of Bangladesh. This city is situated on the estuaries of the Karnaphuli River and it surrounds with hill tracks and faces the Bay of Bengal at west side. The latitude and longitude of the city is 22°20'06" N and 91°49'57" E, respectively. The area of Chittagong metropolis is about 5,282.92 km2, in which the urban area is 2,054.90 km2 while metro is around 2,510 km2. It has an average population density of 19,800 km2 [31]. As the city is the main hub for education, health, and commercial activities, the traffic scenario is rapidly changing due to heavy influx of population from different parts of the district as well as from neighboring districts. A huge number of vehicles moving into the city everyday leading to high influx of traffic. Thus, road traffic, a major/dominant source for environmental noise in the Chittagong City is a main subject for this study.
In the present study, noise level data were collected from twelve areas that are categorized into three zones (i.e., residential, commercial and silence zones) of Chittagong Metropolitan City. Silence zones are the area which includes educational institutes, hospitals, Courts, Governmental offices, religious place within 100 m of its boundary. Residential zone includes Khulshi (A1), Sugandha (A2), Chandgaon (A3), and Mousumi (A4) areas; commercial zone includes Agrabad (A5), New market (A6), Muradpur (A7), and Nasirabad (A8) areas; silence zone includes Chittagong College (A9), Bawa School & College (A10), Chittagong Metropolitan Hospital (A11), and Chittagong Medical College (A12) areas. For this study, Chittagong City Corporation map was used for noise mapping. All the selected areas are shown in Fig. 1.
2.2. Noise parameter
Three parameters, namely LAeq, Lmax, and Lmin were used as noise parameters. LAeq is suggested as international standard for measuring noise. The sound level in dB(A) is defined as follows (Eq. 1).
Where, p = Root-mean-square sound pressure (Newton per meter2), p0 = Standard reference pressure corresponding to the weakest audible sound (20 micro newtons per meter2). The apparent loudness of sound doubles for every 10 dB(A) increase in sound level [25].
2.3. Sound level meter and Global positioning system
In this study, noise levels were measured by using a sound level meter (SLM) (Model: AR-824, company: Smart Sensor, made in China). According to IEC651 & ANSIS1.4 it is type-2 SLM. Usually, a sound level meter consists of a microphone and an electronic circuit including an attenuator, amplifier, weighting networks or filters and a display unit (Fig. 2(a)). The microphone converts the sound signal to an equivalent electrical signal. The signal is passed through a weighting network which provides a conversion and gives the sound pressure level in dB(A). This meter is quite easy to move and take the reading for measurement ranges from 30 to 130 dB(A). This meter allows to select between fast and slow response times as well as A and C weighting. For determining the exact position of each locations, global positioning system (GPS) was used by using a GPS meter (Model: eTrex-10, company: Garmin, country: United States). It can locate the position quickly and precisely with its high sensitivity. The GPS was turned on at each location and the latitude and longitude readings were taken (Fig. 2(b)).
2.4. Data collection and analysis
The noise data were collected from twelve areas from 1st May 2019 to 28th May 2019 except holidays (Friday, Saturday) during the morning (7-9 am), afternoon (12-2 pm) and evening (7-9 pm). The weather was dry, the rain and the wind speed were negligible on these days. The SLM (Type-2, Model: AR-824, company: Smart Sensor, made in China) was set for A-weighting with measuring level range of 30-130 dB and it gives reading in dB. The measurements were carried out for two days in each location at road junctions. In every period morning, afternoon, evening the measurements were taken for 2 hours with three interval of 5 minutes. These data were taken 1.5 meter above the ground surface near the roadsides to avoid noise that generates by wind conditions. Before each data collection the SLM was calibrated. For determining the exact position of each locations, GPS meter was used. From every data collection LAeq,2h, Lmax, and Lmin were measured and recorded in the computer for noise mapping and analysis. Finally, the noise levels data were used to compare with standard noise level data recommended by Department of Environment (DOE), Bangladesh and to create the noise map of Chittagong City by using GIS for addressing the zones that are mostly vulnerable.
2.5. Geographic information system and noise mapping
ArcGIS is well proven desktop Geographic Information System (GIS) software that is widely known for its user friendliness and stability. By using spatial data, ArcGIS can provide a powerful set of tools for storing and retrieving, transforming, and displaying. ArcGIS 10.4.1 software is used for preparing noise level map for different times of the day so that it can show the diurnal variation of high noise level zones of Chittagong City. GIS tools provide different spatial modeling methods. Inverse Distance Weighted (IDW), Natural Neighbor Inverse Distance Weighted (NNIDW), Spline, Kriging & Trend are the methods for interpolations. After evaluating different interpolation methods, IDW method was selected for generating noise color contour based on equivalent noise levels (LAeq,2h) behavior of the locations in the study area. This interpolation i.e., IDW is one of the most commonly used techniques and it also has higher accuracy than other interpolation methods [19]. IDW weight each point by the inverse of the distance and after that the reference point assign each measurement. This method provided exact weighted interpolated surface grid. Furthermore, IDW provides satisfactory results for predicting vulnerable noise zone maps. By analyzing noise level of point locations, IDW can evaluate noise level of surrounding areas. Thus, more vulnerable areas can be identified with better visual information by applying this method. A georeferenced map of Bangladesh was used. A shape file of Chittagong City Corporation (boundary of twelve areas) was used to plot the geographical coordinates of noise recorded points. After interpolation, the noise ranges were designated with color code and reflected in the map in the form of vulnerable zones in different form of color contours. (Eq. 2), is the formula which represents IDW [19].
In this formula, Z is the interpolated value for a specified point with an unknown observed value. wi is the weighting function which determines the relative importance of every individual control point Zi in the procedure of interpolation, Zi represent the observed value at each control point i where, i=1, …, n and the control is the closest neighborhood of this interpolated point, and n is the total number of points that are used in interpolation. The co-ordinate system projection was WGS_1984_UTM_ZONE_45N. For tabular data analysis interpretation MS-Excel (2013) software was used.
2.6. Risk evaluation criteria
To analyze noise risk zones (NRZ) in Chittagong City, the evaluation criteria were adopted from Sankari et al. (2010) which is divided into six zones based on noise intensity levels (Table 2).
3. Results and discussion
3.1. Evaluation of noise levels
The noise levels at twelve different locations of Chittagong City were measured at different time intervals such as morning, afternoon, evening and are presented in Table 3. For residential zones, it can be appeared from Table 3 that the minimum noise level (Lmin) was 52.5 dB(A) during morning period at Khulshi (A1) area and the maximum noise level (Lmax) was 95.0 dB(A) during the same period at Sugandha (A2) area. However, the equivalent noise level (LAeq,2h) varied between 55.0 and 74.8 dB(A) and the average noise level of residential zone was found 64.6 dB(A). For commercial zones, Lmin was measured 60.1 dB(A) during morning period at Agrabad (A5) area and Lmax was noticed 97.3 dB(A) during evening period at Nasirabad (A8) area. LAeq,2h varied between 66.8 and 83.5 dB(A) while the average noise of commercial zone was observed 76.9 dB(A). For silence zones, Lmin was found 61.1 dB(A) during morning period at Chittagong Metropolitan Hospital (A11) area and Lmax was found 97.7 dB(A) during evening period at Bawa School & College (A10) area. LAeq,2h varied between 67.3 and 81.8 dB(A) whereas the average noise of silence zone was observed 75.5 dB(A). Comparing with morning and evening period, the noise environment remains relatively lower during noon time having less traffic flow as it was free from the opening and closing session. From the results it can be said that the silence and commercial zones were facing serious noise pollution than residential zone.
3.1.1. Morning period (7-9 am)
In the morning period, Lmin and Lmax were observed 52.5 and 97.0 dB(A) in Khulshi (A1) and Nasirabad (A8) area, while the LAeq,2h was varied from 55.0 to 78.5 dB(A). Based on LAeq,2h, the residential zones, Sugandha (A2) and Mousumi (A4) areas were exposed to higher noise pollution than other two areas which were measured 64.1 and 65.0 dB(A), respectively because the A2 and A4 areas have high density of traffic in this region. In the commercial zones, Nasirabad (A8) area was facing higher noise pollution (78.5 dB(A)) than other three areas because of having organized industrial zone on this route and high traffic mobility. In the silence zones, Bawa School & College (A10) and Chittagong College (A9) areas were mostly vulnerable than other two areas and the LAeq,2h were measured 74.1 and 76.6 dB(A), respectively. A9, A10 areas were facing high noise pollution because the educational institutions are adjacent to the major roads.
3.1.2. Afternoon period (12-2 pm)
The noise levels, Lmin and Lmax in the study area were observed 60.0 dB(A) in Khulshi (A1) and 96.9 dB(A) in Nasirabad (A8) areas same as the morning period. A1 area was encountering less noise pollution due to having less traffic movement. Mostly in every areas LAeq,2h were high and varied from 65.0 to 83.5 dB(A). Based on LAeq,2h, Sugandha (A2) area was exposed to higher noise pollution (74.8 dB(A)) than other three areas of residential zones as it was crowded with all type of vehicles during this period. In the commercial zones, Nasirabad (A8) and New Market (A6) areas were experiencing higher noise pollution than other two areas and the LAeq,2h were measured 83.5 and 80.2 dB(A), respectively. The noise pollution was high in the A8 area for plying of more heavy vehicles while the A6 area having three-wheeler stand and lots of shop in the footpath, consequently, the intensity of noise was higher during this period due to huge accumulation of traffic. From all the measured noise levels, LAeq,2h were above 75.0 dB(A) in the silence zones (A9, A10, A11, and A12), however, Bawa School & College (A10) area was facing the highest noise of 81.8 dB(A). As the hospitals and educational institutions are adjacent to the major roads, people of this area were highly affected.
3.1.3. Evening period (7-9 pm)
The noise levels, Lmin and Lmax were found 58.0 dB(A) in Khulshi (A1) area and 97.7 dB(A) in Bawa School & College (A10) area at evening period. A1 area had the minimum noise environment in all periods so the inhabitants of Khulshi area was facing less noise pollution compared to other areas. In the evening, the LAeq,2h were high and varied from 63.0 to 83.1 dB(A) in all studied areas. Based on LAeq,2h, Sugandha (A2) and Chandgaon (A3) areas were exposed to higher noise pollution than other two areas in the residential zones which were measured 67.5 and 67.1 dB(A), respectively. Nasirabad (A8) and New Market (A6) areas were experiencing greater noise pollution than other two areas of commercial zones, and the noise level were measured 83.1 and 79.6 dB(A), respectively. A8 area was confronting high noise pollution in all three periods because of the improper traffic management and the exits of flyovers leading to heavy traffic congestion. Bawa School & College (A10) and Chittagong Metropolitan Hospital (A11) areas were encountering higher noise levels than other two areas of silence zones and the noise levels were measured 80.8 and 79.0 dB(A), respectively. A10, A11 areas were in the grip of heavy traffic noise and disturbances because of lacking parking spaces, two-three wheelers, and narrow roads.
The areas in the residential zone suffer with noisier environment in the noon time than the morning and evening times of the day. Commercial and silence zones were experiencing higher noise environment in the noon and evening times than the morning time of the day. A study of six major road intersection in Khulna City showed that the high level of traffic flow and low level of traffic management were the main reasons of high traffic noise level [26].
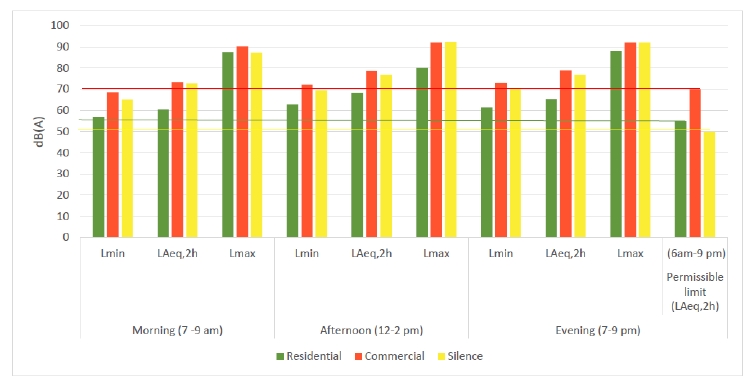
3.2. Comparison of noise levels with standard
The noise levels that obtained in the present study were compared to the Noise Control Standards in Bangladesh and is shown in Fig. 3. According to the standard values for outdoor noise level set by the Department of Environment (DOE), Bangladesh, the maximum permissible limits of noise levels are 55, 70, and 50 dB(A) for residential, commercial and silence zone, respectively during the time 6 am to 9 pm which is considered as day. For residential zone, the average LAeq,2h were determined as 60.4, 68.2 and 65.3 dB(A) for morning, afternoon, and evening hours, respectively which exceed the standard level 55 dB(A) for every periods. For commercial zone, the average LAeq,2h were determined as 73.4, 78.6 and 79.0 dB(A) for morning, afternoon, and evening hours, respectively which go beyond the standard level 70 dB(A) for all periods. The average LAeq,2h were determined as 72.7, 77.0 and 77.0 dB(A) for morning, afternoon, and evening hours, respectively in silence zone which exceed the standard level 50 dB(A) for all periods.
From these observations it can be observed that all zones were exposed to high noise pollution and exceeded the regulatory standards. However, the commercial zones were experiencing more noise pollution that other zones for all periods. This observation was comparable to a study that was carried out for 25 locations of Chittagong City [30]. They observed that the maximum noise level appeared in the roadside at AK Khan and Agrabad circle (93 dB(A)) which exceeded the standard limit (60 dB(A)) set by Government of Bangladesh. In another study, it was found that the workers in Jute Mills of Chittagong City are gradually losing their listening ability [2]. Nevertheless, the silence zone was the most vulnerable one than other two zones according to the DoE standard noise level. A survey showed that the three educational institutions such as Krishno Kumari City Corporation Girls’ High School, Newmarket; Aparna Charan City Corporation Girls’ High School and College, Newmarket; City Corporation Girls’ School and College, Kaptai Raster Matha which are located near the roadside of Chittagong City, and hence, they were exposed to high noise pollution [24,30]. To sum up, the noise level survey in the present study revealed that noise environment of Chittagong City is not satisfactory, and the scenario is deteriorating day by day probably due to the exponential increase in population and increasing number of vehicles. For better understanding, the spatial distribution maps for noise pollution for morning, noon and evening periods could be developed to take remedy measures.
Table 4 shows the comparison of noise level of different cities in Bangladesh.
All the measured noise levels in different cities exceeded the permissible limit. It can be considered that the noise pollution in different cities of Bangladesh is rapidly increasing. In this study, the noise level of Chittagong was found 72.3 dB(A) (field survey 2019) which was higher than Jamalpur (70.2 dB(A)) and Khulna city (62.9 dB(A)). However, the noise level status of other cities even shows the worst noise environment than Chittagong City where Mymensingh, Rajshahi, and Sylhet cities were facing the highest noise pollution.
3.3. GIS noise mapping
For noise mapping, noise level data that obtained from twelve locations of the Chittagong City along with geographical coordinates by GPS were plotted in ArcGIS 10.4.1 software using contours interpolation (i.e., IDW) technique. Predicted noise map along with color contours were prepared for different time zones i.e., morning, afternoon and evening and are presented in Fig. 4. To show the diurnal variation of the noise environment in Chittagong City, the noise maps were prepared for different times of the day. The noise map shows that in morning period, areas A1, A2, A3, A4 were experiencing noise level from 55-64 dB(A), areas A5, A11 were experiencing 65-70 dB(A) and rest of the areas A6, A7, A8, A9, A10, A12 were experiencing 71-78 dB(A). In afternoon period the areas A1, A3, A4 were experiencing noise level from 65-72 dB(A), areas A2, A5, A7, A9, A11, A12 were experiencing 73-77 dB(A) and areas A6, A8, A10 were experiencing 80-83 dB(A). Compared with morning period the noise level increased in afternoon. In evening period the areas A1, A2, A3, A4 were experiencing noise level from 63-71 dB(A), areas A7, A9, A12 were experiencing 72-76 dB(A) and areas A5, A6, A8, A10, A11 were experiencing 77-83 dB(A). The noise environment in the evening period were almost same as afternoon period. The figures demonstrate that the noise levels were increasing as moving towards center of the city, i.e., from the area A1, A2, A3, A4, A5, A7, A9, A12 towards the area A6, A10, A8, A11. Specially, the areas of New Market (A6), Nasirabad (A8), and Bawa School & College (A10) were highly exposed to noise pollution in all the three different time intervals.
The predicted maps demonstrate that all the areas comprising of residential, commercial and silence zones were in the grip of higher noise levels which is more than 60 dB(A). From this noise maps, it is evident that the afternoon and evening periods (Fig. 4(b) and 4(c)) were experiencing much higher coverage of noise pollutions than the morning period (Fig. 4(a)). The main reasons for this noisy environment are, these places were hugely populated having large number of vehicles like private cars, buses, good carrying trucks, and two-three wheelers. Another reason for the elevated noise levels in these areas might be due to improper traffic management and having lack of parking spaces.
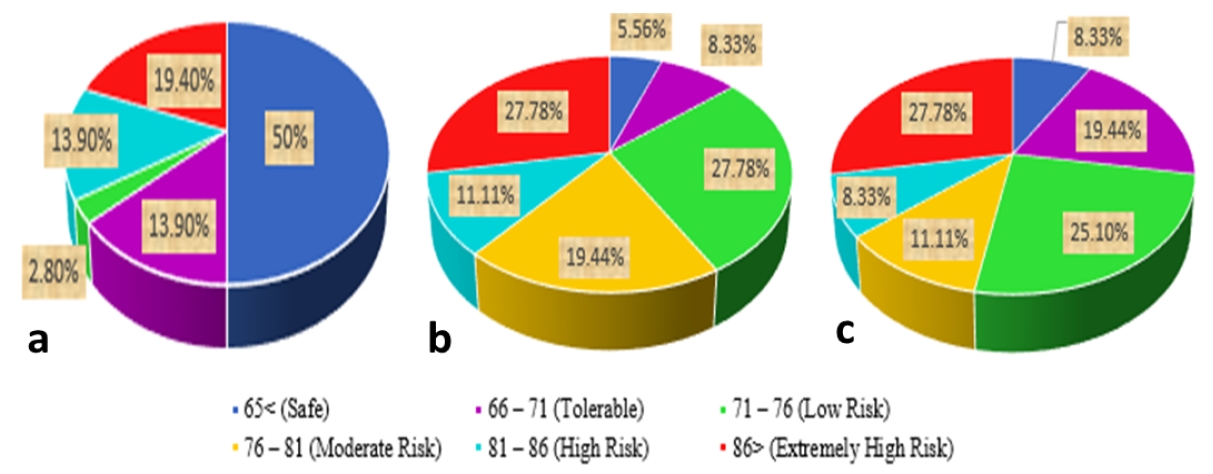
3.4. Evaluation of noise risk zone and impact on human health
The percentage (%) distribution of noise levels is presented in Fig. 5 to identify the noise risk zones of the city. All the noise parameters were used to find out NRZ. About 33.3% of the areas of the residential zone were found within high risk and extremely high-risk category and remaining areas were found under safe to low-risk category.
About 50% of the areas found under safe zone in residential areas might be due to the less traffic mobility. For commercial zones, about 58.33% areas were found within moderate risk, high risk and extremely high-risk zone category while 47.22% areas were found within moderate risk, high risk and extremely high-risk zone category for silence zones. The noise risk zone evaluation indicates were unsuitable for the noise environment of Chittagong City.
The physicians categorized the noise levels and their impacts on human as the following: 0 to 20 dB(A): normal; 20 to 45 dB(A): mild hearing loss; 40 to 67 dB(A): moderate harmful; 70 to 100 dB(A): serious hearing loss; more than 100 dB(A): acute health hazard [25]. As the minimum sound levels were found 52.5 dB(A) in this city, that means the sound is creating moderate harmful to serious hearing loss to the dwellers of this City. Noise pollution may not cause immediate effects, but it is surely impacting us in many ways. The effects of this pollution arise gradually and have long-term impact on auditory and nervous system of humans that may bring hearing loss. The average noise level in Chittagong City was found 72.3 dB(A) and all the parameters of noise level in all the areas were found higher than acceptable limit. This noise pollution could create illness like headache, sleeplessness, bad temper and obviously hearing problem. Noise pollution can also lead to mental stress, causing high blood pressure, cardiac failure, and respiratory disorders.
4. Conclusion
In this study, the ArcGIS maps demonstrated that the noise level increases as moving towards the center of the city i.e., from area A1, A2, A3, A4, A5, A7, A9, A12 towards A6, A10, A8, A11. In particular, New Market (A6), Nasirabad (A8), and Bawa School & College (A10) were exposed to high noise pollution in all the three different times. Furthermore, the average noise levels exceeded the regulatory standards prescribed by the DOE (Noise Pollution Control Rules, 2006) for all three zones i.e., residential, commercial and silence zones that ranging between 55-85 dB(A). Specially, the silence zone areas were the most vulnerable compared to the residential and commercial zones. Nevertheless, the afternoon and evening periods were exposed to the noisier environment than the morning period for commercial and silence zone areas in working days. This study suggests that urgent measures should be taken into consideration to control the level of noise pollution in the city and vulnerable institutions like schools, college and hospitals should be located far away from the roadside. Moreover, the remedial and preventive measures such as limiting the private cars, using absorber, green belt and noise barrier, creating more parking spaces, imposing strict traffic regulations, planting more trees for sound cushion in the city, making alternative routes, creating mass awareness can be taken for improving the noise environment of the Chittagong city. The present study of Chittagong City was carried out for some particular areas so the overall scenario of Chittagong city cannot be judged in GIS map (Fig. 4); therefore, further study can be performed for more locations covering the whole city considering seasons and time variations (daily, weekly, and monthly) and taking readings at day time (6 am-9 pm) as well as night time (9 pm-6 am) to get more comprehensive scenarios of noise pollution on this city.