하수처리시설 및 사업장에서 발생하는 지정악취물질의 실태조사
Occurrence of Designated Odor Substances in Wastewater Treatment Plant and Industrial Estate
Article information

Abstract
목적
악취는 발생물질의 종류와 배출원이 다양하고, 여러 물질이 복합적으로 작용하며, 생활환경과 사람의 심리 상태에 따라서 오염도에 대한 인식이 달라지는 특성이 있어 다른 대기오염물질과는 달리 발생원을 효과적으로 관리하고 저감 대책을 수립하는 데에 어려움이 있다.
방법
이를 해결하기 위해 본 연구에서는 대표적인 생활악취 발생원 중 하수처리시설과 사업장을 대상으로 현장에서의 데이터 수집을 통해 악취 배출특성을 파악하고 계절별 악취 발생 경향을 분석하였으며, 최종적으로 악취기여도를 통해 하수처리시설 및 사업장 악취에 기여하는 물질에 대한 평가를 수행하고자 하였다.
결과 및 토의
연구 결과, 하수처리시설은 고농도로 배출되는 물질이 Propionic acid, isoValeric acid, n-Valeric aicd 등의 지방산류 물질인 반면, 사업장은 Toluene, Xylene, Butyraldehyde, Trimethylamine, iso-Valeraldehyde 등 다양한 악취물질들이 배출되었다.
결론
발생농도와 더불어 악취기여도도 큰 차이를 보이는데, 이는 하수처리시설과 사업장의 특성상 악취를 유발하는 약품이나 제조과정에서의 차이인 것으로 사료되나, 두 시설 모두 주요 악취 원인물질이 Trimethylamine과 n-Valeric acid 물질로 나타났다.
Trans Abstract
Objectives
Odor emissions pose a challenge due to the diversity of odor-producing substances, their various sources, and the complex interactions between different compounds. Moreover, people's perception of odor intensity can vary based on their living environment and psychological state, making it difficult to effectively manage and develop mitigation measures for odors, in contrast to other air pollutants. To address this issue, this study focuses on two prominent sources of residential odors, namely wastewater treatment plant and industrial estate.
Methods
Through on-site data collection, the study aims to investigate the characteristics of odor emissions and analyze seasonal trends in odor generation. Ultimately, the study seeks to assess the substances contributing to odors in wastewater treatment plant and industrial estate through odor contribution analysis.
Results and Discussion
The research findings reveal that wastewater treatment plants predominantly emit high concentrations of fatty acid substances such as Propionic acid, iso-Valeric acid, and n-Valeric acid. In contrast, industrial estates release a variety of odor-causing substances, including Toluene, Xylene, Butyraldehyde, Trimethylamine, and iso-Valeraldehyde.
Conclusion
Significant differences are observed both in terms of odor concentration and odor contribution. These disparities are attributed to the specific characteristics of wastewater treatment plants and industrial processes that induce odors. Nevertheless, in both types of facilities, Trimethylamine is identified as a major contributor to odors.
1. 서 론
현대사회에서 산업발전과 더불어 환경오염이 가속화되고 있으며, 이 중 대기오염은 오염원이 다양하고 수많은 화학물질이 공기 중으로 배출되어 호흡이나 접촉 등 직・간접적으로 인간에게 영향을 주고 있다. 대기오염 중에서도 특히 자극성이 있는 물질이 사람의 후각을 자극하여 불쾌감과 혐오감을 주는 냄새인 악취에 대한 문제가 다수 발생 되고 있다.
이러한 악취를 유발하는 주요 배출원은 하수처리시설, 사업장, 축산시설, 매립장 소각시설 등이 있으며, 이 중 하수처리시설은 하수 및 슬러지 처리 과정에서 암모니아, 황화수소, 이황화수소, 메르캅탄 등 여러 종류의 악취물질이 발생 되어 인근 주민들에게 혐오시설로 인식되고 민원의 대상이 되고 있다. 또한, 최근 도시화가 급격하게 진행됨에 따라 산업단지와 인접한 주거지역이 늘어나면서, 사업장에서 발생하는 악취 분석의 필요성이 증가하고 있다[1].
환경부에서는 ‘악취방지법’을 통해 복합악취와 지정악취물질을 구분하여 관리하고 있으며, 지정악취물질은 총 22종으로 암모니아, 트라이메틸아민, 황화합물 4종, 알데하이드 5종, 지방산 4종, 휘발성유기화합물 7종이 있다[2]. 악취는 사람에게 정신적 스트레스를 유발하며 두통, 메스꺼움 등 건강상 해를 주고, 원인물질이 다양하며 순간 발생했다가 사라지기도 하고, 동일한 농도일지라도 사람이 느끼는 악취정도는 다를 수 있으며, 각 성분별 최소감지농도가 달라 단순히 농도를 기준으로 악취 정도를 파악하기가 어렵다[3]. 이러한 악취의 특성을 보완하기 위하여 단일 악취물질에 대한 악취활성값과 이를 활용한 악취기여도 평가가 이용되고 있다[1].
악취물질의 측정 중 특히 기기분석법은 악취센서 혹은 가스크로마토그래피(GC)같은 장치를 이용하여 악취의 정도를 정량적으로 측정하는 방법으로, 객관적인 데이터를 얻을 수 있지만, 별도의 시료채취와 분석절차 과정에 시간이 많이 소요된다. 또한, 시료채취 과정에서 시간 및 장소에 따른 가용인력과 안정상의 문제가 야기될 수 있다는 단점이 존재한다[4]. 이에 따라, 현장에서 좀 더 간편하고 신속하며 정확한 악취진단 기술에 대한 개발이 필요한 실정이며[5], 악취 발생에 효과적으로 대응하고 발생 현황을 즉각적으로 평가하기 위해서는 연속적인 측정방법으로 악취 오염도를 측정하는 것이 필요하다[6].
따라서 본 연구에서는 지정악취 물질 22종을 대상으로 하수처리시설과 사업장 현장에서의 데이터 수집을 월별, 계절별 악취배출 특성 및 발생 경향을 파악하고자 하였으며, 최종적으로 악취기여도를 통해 하수처리시설 및 사업장 악취에 기여하는 물질에 대한 평가를 수행하고자 하였다.
2. 재료 및 방법
2.1. 대상 시설
하수처리시설은 강원도 소재 부지면적 110,848 m2, 150,000 ton/day의 처리용량을 가진 공공하수처리시설으로 도심지역에서 발생하는 생활하수, 음식물자원화시설의 처리수, 매립장 침출수 등을 처리하고 있다. 본 연구에서는 하수처리시설의 1차침전지 인근에 측정기기를 설치하고 연속적으로 샘플을 분석하였다(Fig. 1). 사업장은 충청도 소재 부지면적 419,000 m2, 입주업체 총 44개의 공업단지 내 의약외품, 전자기기 제조업체, 비료 및 질소화합물 제조업체 3개소의 인근에 측정기기를 설치하고 연속적으로 샘플을 분석하였다(Fig. 1).

Wastewater treatment plant(WWTP) and industrial estate(IE).
2.2. 측정 방법
악취물질은 22종의 지정악취물질을 대상으로 하며, 열전도도검출기(TD)와 가스크로마토그래피(GC)를 활용하여 2022년 8월 1일부터 2023년 7월 31일까지 1년간 20분 간격으로 측정하였다. Fig. 2는 대상 시설의 국지기상을 나타낸 것으로, 하수처리시설은 북서풍과 남서풍의 영향이 우세하였고 사업장은 동풍의 영향이 우세하였다. 그 외 자세한 분석 조건은 Table 1, 2에 정리하였다.

Wind rose of WWTP and IE.
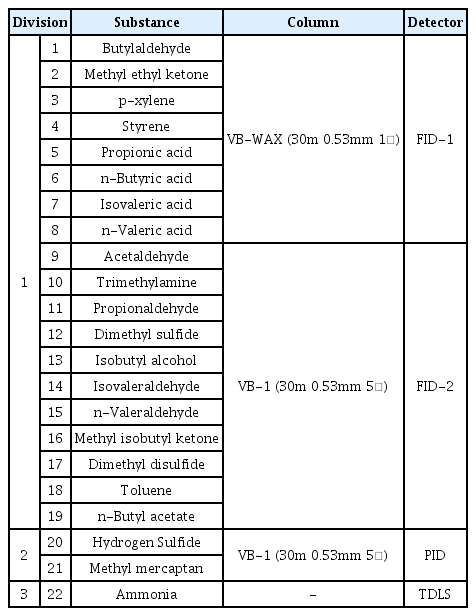
Detection items by analysis condition.
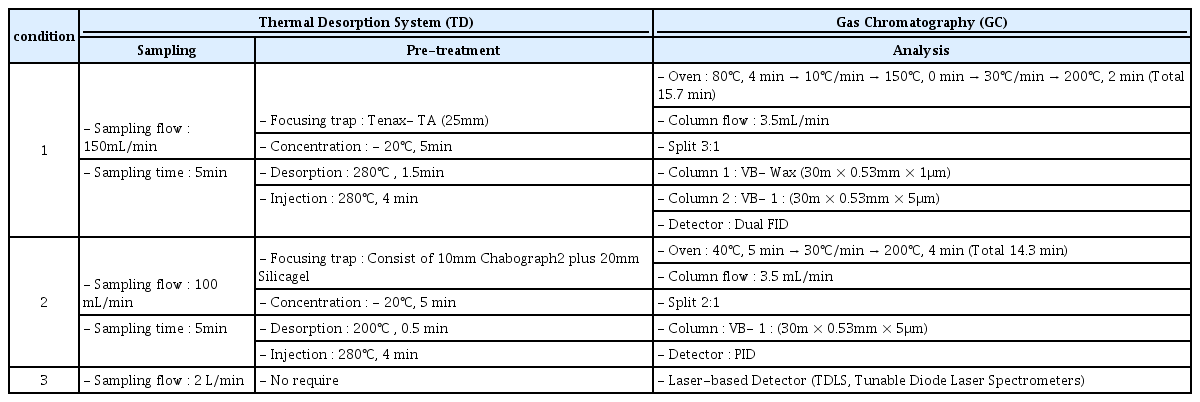
Analysis conditions.
2.3. 악취기여도 평가
악취기여도 평가는 개별 악취물질이 가지는 최소감지농도를 이용하여 개별 악취물질들이 전체 악취발생 정도에 미치는 기여도를 평가하는 방법이다[1,7]. 악취활성값(Odor Activity Value, OAV)은 개별 악취물질의 농도를 각각의 악취물질이 가지는 최소감지농도로 나눈 값으로 정의하고, 이러한 개별 물질들의 악취활성값을 합한 것을 총악취활성값(Sum of Odor Activity Value, SOVA)이라 하며, 악취물질의 기여도(Odor Contribution, OC)는 개별 악취활성값을 총악취활성값으로 나눈 값을 100(%)으로 환산한 비율로 평가한다. 관련 식은 (1)~(3)에 나타내었다.
본 연구에서는 1년 간 20분 간격으로 측정된 지정악취물질의 농도를 산술평균하고 최소감지농도로 나누어 산출한 악취활성값으로 악취기여도를 평가하였으며, 최소감지농도는 환경부에서 제시한 악취기술진단 실무 매뉴얼을 기준으로 하였다[8].
3. 결과 및 고찰
3.1 악취 배출특성
3.1.1. 월별 악취 배출특성
월별 악취 배출특성 결과는 Fig. 3에 나타내었다. 대상 하수처리시설은 8부터 11월까지 Propionic acid, Valeric acid 등 지방산류 악취물질들의 농도가 높게 나타났으며, 이후에는 비교적 낮은 농도로 Acetaldehyde와 Trimethylamine, Hydrogen sulfide가 주로 배출되었다. 하수처리시설에서는 보통 황화합물이 높게 배출되는 기존문헌[9,10,11]과 달리 대상 시설에서는 8월부터 11월까지 지방산류 물질의 배출이 높게 나타났다. 지방산류 물질은 유기체의 혐기성 생물학적 분과정에서 주로 발생하는데, 이는 hydrolysis, acidogenesis, acetogenesis, methanogenesis와 같은 과정을 통해 이루어지며 하수처리시설에서 발생하기도 한다[12,13]. 해당 기간 동안 지방산류 물질의 농도가 높았던 이유는 하수처리시설로 유입되는 분뇨의 양이 증가하였거나[14], 측정지점인 1차 침전지 인근 정비 공사로 인한 영향으로 사료된다.

Monthly odor emission characteristics in WWTP and IE.
사업장은 특히, 10월에 Toluene(50.19ppb), Xylene(30.17ppb), Butylacetate(18.89ppb), iso-Butylalchol(18.06ppb), Methyl ethyl ketone(14.51ppb)이 고농도로 배출되었으며, 알데하이드류 물질인 Butyraldehyde이 9월과 10월에 각각 25.23ppb, 22.93ppb로 배출되었다. Trimethylamine은 8월, 1월, 4월을 제외하고 배출되었으며 12월은 n-Valeric acid(9.77ppb), Propionc acid (7.20ppb)이, 3월은 Propionaldehyde(22.37ppb), Methyl ethyl ketone(14.70ppb)이 배출되었다. 휘발성유기화합물은 공기 중으로 쉽게 증발되는 탄화수소류나 유기용제를 말하며 석유화학산업, 의약품, 전자산업, 목재가공산업 등 각종 산업체 에서 배출되는 물질로[15,16], 대상시설에서 휘발성유기화합물의 배출이 높았던 이유는 측정 장치 인근에 위치한 의약품, 전자기기 제조업체로 인한 영향으로 사료된다. 특히 본 연구에서 농도가 가장 높았던 Toluene은 타 연구결과[17,18]에서도 일반적으로 산단 지역 대기 중에 존재하는 휘발성유기화합물 중 가장 비율이 높은 것으로 나타났다.
3.1.2. 계절별 악취 배출특성
계절별 악취 배출특성 결과는 Fig. 4에 나타내었다. 하수처리시설은 가을에 특히, 지방산류 물질인 Propionic acid (16.16ppb), iso-Valeric acid(4.88ppb), n-Valeric acid(4.40ppb)가 고농도로 배출되었으며, 봄, 여름, 겨울은 Acetaldehyde(1.04~2.34ppb), Trimethylamine(1.07~2.66ppb), Hydrogen sulfide(0.61~ 1.73ppb), n-Valeric acid(0.76~3.02ppb)가 배출되었다.

Seasonly odor emission characteristics in WWTP and IE.
사업장은 가을에 Butyraldehyde (21.21ppb), Toluene (14.51ppb), Methylethylketone(13.81ppb), Xylene(8.90ppb), n-Valeric acid (6.23ppb), 봄은 Trimethylamine(11.60ppb), Propionaldehyde (10.79ppb), Methyl ethylketone(8.41ppb)이 배출되었으며, 봄과 가을의 배출 농도가 높은 경향을 나타냈다. 겨울은 Trimethylamine(7.08ppb)을 제외하고 다른 계절에 비해 낮게 나타났다.
3.2. 악취기여도 평가
악취기여도 결과는 Fig. 5에 나타내었다. 하수처리시설의 악취기여도는 n-Valeric acid 43%, Trimethylamine 27.03%, iso-Valeric acid 15.91%, n-Butryric acid 4.73%로, n-Valeric acid와 Trimethylamine이 주요 악취 원인으로 나타났다.

Contribution compounds of designated odor in WWTP and IE.
사업장은 Trimethylamine 57.47%, n-Valeric acid 27.95%, iso-Valeric acid 4.78%, n-Butryric acid가 2.97%로, Trimethylamine이 주요 악취 원인으로 나타났다.
4. 결 론
본 연구에서는 하수처리시설과 사업장을 대상으로 2022년 7월부터 2023년 8월까지 1년간 20분 단위로 지정악취물질 22종을 측정하여 악취 발생 특성을 분석하였다. 월별 악취배출특성 결과, 하수처리시설은 특히 8월부터 11월까지 Propionic acid, Valeric acid 등 지방산류 물질이 고농도로 배출되었으며, 이후에는 비교적 낮은 농도로 Acetaldehyde와 Trimethylamine, Hydrogen sulfide가 배출되었다. 사업장은 측정기간 동안 다양한 물질들이 배출되었는데 특히, Toluene, Xylene, Butylacetate, iso-Butylalchol, Methylethylketone이 10월에 고농도로 배출되었다. 계절별 악취배출특성 결과, 하수처리시설은 가을에 지방산류 물질(Propionic acid, iso-Valeric acid, n-Valeric acid)이 고농도로 배출되었으며, 봄과 여름, 겨울은 Acetaldehyde, Trimethylamine, Hydrogen sulfide가 가을에 비해 낮은 농도로 배출되었다. 사업장은 봄에는 Trimethylamine, Propionaldehyde, Methylethylketone, 가을에는 Butyraldehyde, Toluene, Methylethylketone, Xylene, n-Valeric acid가 배출되었으며, 봄과 가을의 배출 농도가 높은 경향을 나타냈다. 겨울에는 Trimethylamine을 제외하고 타 계절 대비 낮은 경향으로 나타났다. 악취기여도를 평가한 결과, 두 시설 모두 Trimethylamine과 n-Valeric acid, I-Valeric acid의 악취기여도가 높게 나타났는데, 이는 해당 물질들의 배출 빈도 및 농도가 높고 최소감지농도가 각각 0.032, 0.037, 0.078로 매우 낮아 다른 악취물질들에 비해 악취기여도가 높은 것으로 확인되었다. 하수처리시설의 경우 특정기간동안 지방산 물질의 고농도 배출은 분뇨유입량의 증가 또는 측정 지점 인근 정비 공사에 기인한 가능성이 있으나, 정확한 원인 규명을 위해서는 향후 추가적인 연구가 필요하다.
Acknowledgements
본 연구는 한국환경산업기술원(환경부) 대기환경 관리기술 사업화 연계 기술개발사업의 연구비 지원을 받아 수행된 연구입니다(과제번호: 2021003400006).
Notes
Declaration of Competing Interest
The authors declare that they have no known competing interests or personal relationships that could have appeared to influence the work reported in this paper.