환경산업연관분석(EEIOA)을 이용한 경제 부문별 온실가스 배출량 특성분석
Characterization of Greenhouse Gases Emissions by Economic Sectors Using Environmentally Extended Input-Output Analysis (EEIOA)
Article information

Abstract
목적
기후변화가 심화되면서 2050 탄소중립 개념이 도입되었고, COP 26 글래스고 회의에 의해 2030년 국가 온실가스 감축 목표도 크게 강화되었다. 그러나 에너지 정책과 경제 부문별 온실가스 배출 특성을 고려할 때 온실가스 감축 목표의 실현 가능성에 대한 논란이 있다. 이런 점을 고려하여, 본 연구에서는 2017 환경산업연관표를 작성하고, 이를 통해 경제활동별 온실가스 배출특성을 분석하고자 하였다.
방법
이산화탄소 배출량은 연료별 발열량과 배출계수를 이용하여 연료원별 이산화탄소 배출계수를 2017년 에너지밸런스에 적용하여 계산하였으며, 그 외의 온실가스 배출량은 국가 온실가스 인벤토리 자료를 이용하였다. 모든 온실가스 배출량을 부문별 온실가스 배출특성을 파악할 수 있도록 산업연관표의 381개 기본 부문으로 할당한 후 대분류와 유사한 35개 부문으로 통합하여 2017 대한민국 산업연관표(ROKEEIOT)를 작성하였다. 이를 이용하여 경제활동별 배출량과 배출계수를 산출하고 Scope 1, Scope 2 및 Scope 3에 따른 온실가스 배출 특성을 분석하였다.
결과 및 토의
본 연구에서 작성된 2017 ROKEEIOT로 산출한 이산화탄소 배출량을 2017년 정부의 공시된 온실가스 배출통계 자료와 비교한 결과 2%의 차이를 보여주어, 2017 ROKEEIOT는 실효성이 매우 높음을 확인하였다. 온실가스 직접 배출량 상위 3개 산업은 전력 및 신재생에너지와 증기 및 온수 공급업(262,280 kt CO2eq.), 1차 금속 제품업(117.098 kt CO2eq.), 운송업(58,332 kt CO2eq.)순이 였으며, 온실가스 총 배출량 상위 3개 산업은 건설업 (151,476 kt CO2eq.), 운송장비업(112,168 kt CO2eq.), 컴퓨터, 전자 및 광학기기업(107,868 kt CO2eq.) 순으로 나타나 서로 상이함을 확인하였다. 또한, 온실가스 총 배출량 Scope별 구분한 결과 Scope 1에서 50%를 넘는 산업은 6개였으나, Scope 3에서 50%를 넘는 산업은 29개가 나옴에 따라, Scope 3에 의해 발생되는 온실가스 배출량을 고려한 공급망 및 가치사슬에 따른 온실가스 감축대책이 필요함을 확인할 수 있었다. 특히, 수출에 의한 온실가스 배출 기여가 최종수요의 41.68%에 이르러 탄소국경조정제도 도입에 대비한 수출산업의 탄소경쟁력 강화가 시급함을 확인하였다.
결론
산업부문의 경제적인 기여도와 온실가스 직접 배출량과 공급망 및 가치사슬에 따라 유도된 온실가스 간접 배출량이 경제활동별로 매우 다른 양상을 보여주었다. 따라서, Net zero 나 기후변화 대응과 같은 온실가스 저감을 위한 과학적 정책은 경제활동별 직접 배출인 Scope 1, 전력 및 증기 사용에 의한 Scope 2, 그리고 공급망 및 가치 사슬에 따라 발생되는 Scope 3의 배출특성이 반영되어야 함을 확인할 수 있었다.
Trans Abstract
Objectives
As climate change deepened, the concept of 2050 carbon neutrality was introduced. The COP 26 Glasgow Agreement strengthened the national greenhouse gases (GHGs) target of 2030. However, there are controversies over the feasibility of these GHGs reduction goals, considering the economic sectors energy policy and the attributes of GHGs emissions. Taking this into consideration, this study aimed to formulate the 2017 Environmentally Expanded Input-output Table to analyze the characteristics of GHGs emissions in Korea's economic sectors.
Methods
The carbon dioxide emission was calculated by multiplying carbon dioxide emission factors to fuel consumption in the 2017 energy balance table, while other GHGs emissions are taken from the national GHGs inventory. All the GHGs emissions calculated and taken were allocated to 381 basic sectors of the Input-Output Table to represent each sector's characteristics of GHGs emissions. Then 381 sectors are combined into a large category of 35 sectors to formulate the 2017 Republic of Korea Environmentally Extended Input-Output Table (ROKEEIOT). Using this ROKEEIOT, the emission of Scope 1. 2, and 3 by economic sectors were estimated, and the GHGs emissions and GHGs intensity by economic sectors.
Results and Discussion
The carbon dioxide emissions calculated by the 2017 ROKEEIOT prepared in this study showed a difference of 2% from the 2017 national GHGs emission statistics, confirming that the 2017 ROKEEIOT is very effective. The three economic sectors with the highest direct GHGs emissions were electricity, steam, chilled or hot water, air conditioning supply (262,280 kt CO2eq.), primary metal products (117.098 kt CO2eq.), and transportation equipment (58,332 kt CO2eq.). However, the total GHGs emissions were different in the order of construction (151,476 kt CO2eq.), transportation equipment (112,168 kt CO2eq.), computer, and electronic and optical instruments (107,868 kt CO2eq.). As a result of classifying the scope of GHGs emissions, 6 industries exceeded 50% in Scope 1, and 29 sectors exceeded 50% in Scope 3, indicating that GHGs reduction measures were necessary for the supply chain in consideration of the GHGs emissions characteristics by economic sectors. In particular, 41.68% of GHGs emissions induced by final demand were generated by exports confirming, confirming the urgent need to strengthen the carbon competitiveness of export industry in preparation for the introduction of the carbon border adjustment mechanism.
Conclusion
The economic contribution, direct GHGs emissions of industries, and the amount of GHGs emissions induced by supply chains and value chains show very different patterns by economic sectors. Therefore, it was confirmed that scientific policies to reduce GHGs emissions, such as net-zero and climate change measures, should reflect the characteristics of Scope 1, which is direct emission by industry, Scope 2 emissions caused by electricity and steam consumption and scope 3 emissions generated along the supply chain or value chain.
1. 서 론
지구 온난화로 인한 폭염, 폭설, 태풍, 산불 등 이상기후 현상이 일상화되면서, 기후변화에 대응하는 국제사회의 대응도 급격하게 강화되고 있다. 그러나, 기후변화에 대한 국제사회의 대응은 1992년 브라질의 리우데자네이루에서 열린 유엔환경개발회의(United Nations Conference on Environment and Development, UNCED)에서 기후변화에 관한 유엔 기본 협약(United Nations Framework Convention on Climate Change, 이하 ‘UNFCCC’)을 채택하면서 30년전 부터 시작되었다. 구체적인 노력으로는 선진국에만 의무를 부여하였던 교토의정서가 1997년에 채택된 후 선진국과 개도국이 모두 참여하는 파리협정이 2015년 채택되었고, 2016년 11월 4일 협정이 공식 발효되었다[1]. 우리나라는 2016년 11월 3일 파리협정 국내 비준 절차를 완료하였다[1]. 파리협정은 기후변화 대응 정책의 장기인 비전 관점에서 각 당사국에게 장기 저탄소 발전전략(Long-term Low greenhouse gas Emission Development Strategy, LEDS)을 2020년까지 수립하도록 권고하였다[2].
한국은 파리협정에 대응하기 위해 2016년에 2030 온실가스 감축 로드맵을 수립하였으며, 2018년에 2030 온실가스 감축 로드맵 수정안 및 2018~2020년 배출권 할당계획에 따라 2030년까지 온실가스 배출 전망치(Business As Usual, BAU) 대비 37% 감축목표를 세웠다[3]. 그 후 2020년엔 ‘지속가능한 녹색 사회 실현을 위한 대한민국 2050 탄소중립전략’ [2]을 제시하였으며, 2021년에 제출된 2030 국가 온실가스 감축목표(NDC) 상향안에는 2030년까지 2018년 온실가스 배출량(727.6백만톤) 대비 40%(291백만톤) 감축하는 것을 목표로 하고 있다[4]. 또한 2050 탄소중립 시나리오를 발표하였다[5]. 2022년 3월 기후위기 대응을 위한 탄소중립·녹색성장 기본법이 시행[6]되었다. 그러나, 정부에서 발표된 기후변화 대책들이 경제활동에 따른 에너지 생산 및 소비와 연계된 이산화탄소 발생 특성을 제대로 반영하지 못하고 있다는 의견들이 있어, 실효성에 대한 논란이 많은 것이 현실이다.
실효성 있는 감축계획을 수립하기 위해서는 정확한 온실가스 배출량의 산정과 경제 주체들의 활동에 따른 온실가스 배출 특성의 파악이 우선적으로 필요하다. 온실가스 배출량 산정방법은 기후변화에 관한 정부간 협의체 지침(Intergovernmental Panel on Climate Change Guidelines, 이하 ‘IPCC GL’)에 제시되어 있으며, 에너지, 산업공정, 농업, 토지이용, 토지이용 변화 및 임업(Land Use, Land Use Change and Forestry, 이하 ‘LULUCF’), 폐기물 분야로 구분하여 CO2 (이산화탄소), CH4(메탄), N2O(아산화질소), HFCs(수소불화탄소), PFCs(과불화탄소) 및 SF6 (육불화황) 6 종류에 대한 배출․흡수량으로 산정하고 있다[7]. IPCC GL에 따른 국가 온실가스 통계량은 배출원의 특성에 따른 직접 배출에 대하여 측정되고 있다. 이 자료로는 산업별로 전력과 스팀 등 구매에 따른 간접배출(Scope 2)과 공급망 및 가치사슬에 의한 간접배출(Scope 3)에 대한 연관성을 파악하는데 한계가 있다. 또한, 국가 온실가스 통계의 부문도 경제 전반을 나타내는 산업연관표의 경제부문과 일치하지 않아, 경제활동과 연계된 온실가스 배출특성을 파악하는데 한계가 있다.
경제활동에 의한 환경영향 연구는 W.W.Leontief 교수가 “환경 영향과 경제구조: 산업연관분석에 의한 접근 ”이라는 논문을 통해 환경산업연관분석[8] 기법을 제시한 후 기후변화, 물, 대기 및 폐기물 분야 등 다양한 분야에 적용되어 연구가 이루어지고 있다[9-25]. 최근 국외의 연구 사례들을 보면 Long과 Yoshida (2018) [15]는 도시 지역의 에너지 소비와 이산화탄소 배출에 관한 연구로 환경적으로 확장 된 다중 지역 산업연관표(Environmentally Extended Multi-Regional Input-Output Tables (EEMRIOT))를 개발하여 지역 경계를 넘는 상위 공급망을 고려한 지역 환경 영향을 연구하였다. 연구 결과로는 전체 산업분야에서 교통분야에서 배출이 가장 많으며, 간접 배출량 부문은 에너지 공급, 건설, 민간 서비스 부문 가장 많이 배출하는 결과를 보여주고 있었다. 이 연구에서 제시하고 있는 상세한 에너지 소비 및 배출 인벤토리는 지리적 경계를 극복하기 위한 배출 책임 할당에 활용되어질 수 있어 다양한 규모의 탄소 감축 정책에 기여한다고 밝히고 있었다. 또한, Tian 외 (2021) [16]의 연구에서는 2017년과 2018년 중국의 환경 산업연관모델을 개발하여 담수 소비, 이산화탄소(CO2), 메탄 (CH4), 아산화질소(N2O), 질소산화물(NOx), 이산화황(SO2), 유해 미량원소(Hg 포함), As, Se, Pb, Cd, Cr, Ni, Sb, Mn, Co, Cu, Zn, 미세먼지(PM2.5, PM10), 일산화탄소(CO), 휘발성 유기화합물(VOC), 암모니아(NH3) 등 23종의 대기오염물질과 화학적 산소 요구량, 암모니아, 질소화합물, 인 등을 포함한 13가지 수질 오염 물질, 폐기물 등을 고려한 산업별 오염물질 배출량을 산정하여 결과를 보여주었다.
국내의 경우는 산업연관분석을 이용한 물, 폐기물 분야에 대한에 대한 연구[17-19]도 일부 있었으나, 기후변화 대응책과관련된 온실가스와 관련된 연구들이 가장 활발하였다. 최한주, 이기훈(2006) [20]은 1990~2000년 환경 혼합 산업연관모형을 작성하고 산업별 직·간접적 CO2 발생량 등을 분석하였는데, 에너지원으로 무연탄, 유연탄, 원유, 천연가스 그리고 수력 및 원자력 5 종류를 1차에너지로 한정하였다. 박창귀 (2009) [21]는 산업연관표와 에너지소비량표(12개 에너지원)을 이용하여 2003년 하이브리드 산업연관표를 작성하였으며, 에너지원에 따른 CO2 발생량은 자료의 정확성을 위해 기본부문(404부문)에서 추정하고 대분류(28 부문)로 통합하여 작성하였다. 최윤정(2008) [22]은 산업연관표를 이용하여 산업별 온실 가스 배출계수 및 배출유발계수, 최종수요 항목별 온실가스 배출효과, 그리고 1995~2004년 중의 온실가스 배출 증감 요인을 분석하였다. 그러나, 산업부문은 제조업 9부문, 서비스업 8부문 등 국민계정부가가치 분류와 동일한 21부문으로 통합하여 산업연관표 상의 부문별 영향을 파악하는데는 한계가 있었다. 장미란과 강성원(2018) [23]은 지역별 산업연관표와 에너지밸런스를 사용하여 지역별 화석연료 에너지 소비량에 따른 이산화탄소 배출량을 파악하는 세분화 된 연구를 하였다. 그들은 에너지원 사용량을 산업연관표 소분류에 따라 할당하고, 에너지원별 이산화탄소 배출계수는 에너지원별 배출량의 가중평균을 구하여 이용하였으며, 나프타와 윤활기유에 탄소 몰입율을 적용하였다.
최근에 저자들은[24] 2017 고해상도(~380개 섹터) 환경산업연관표(Environmentally Extended Input–Output Table, EEIOT)를 만들어 우리나라 전자산업의 직·간접인 온실가스 배출량을 추정하였다. 우리나라의 전자산업은 최종수요 의한 온실가스 총 배출량이 2017년 국가 온실가스 배출량의 약 8% 를 차지하였으며, 주로 전자 제품 공급망 및 가치사슬에 의해 배출되는 간접 배출 때문인 것으로 나타났다. 특히 전자산업 중 반도체와 디스플레이 부문의 온실가스 총 배출량은 국가 온실가스 배출량의 3.2%와 2.4%로 기여하는 것으로 나타났으며, 이는 전자산업에 대한 온실가스 총 배출량 중 17%인 것으로 나타났다. 전자산업의 직접적인 온실가스 배출량은 국가 배출량의 1%인 것으로 나타났다.
이상에서와 같이 국내외의 경제활동에 의한 온실가스 배출 특성에 대한 연구는 주로 경제활동별 직접배출과 간접배출로 분류하였고, Scope 1, Scope 2 및 Scope 3로 나누어 수행한 연구는 거의 없는 실정이다. 그나마도, 우리나라의 경제활동별 온실가스 배출량과 관련된 연구는 대부분 2015년 이전의 연구로 기술발전과 기후변화에 따른 사회경제 환경이 고려된 최근의 연구는 거의 없는 실정이다. 또한 경제부문도 에너지 밸런스, UNFCCC에서 분류하는 기준을 바탕으로 하여 경제 활동을 나타내는 산업연관부문과 차이가 있었으며, 경제부문이 연구자마다 상이하였다. 본 연구에서는 UNFCCC에 제출한 2050년 탄소중립 전략의 실효성 있는 실행전략을 수립에 필요한 경제활동에 따른 온실가스 기초자료를 파악하는 것을 목표로 하였다. 이를 위해 본 연구에서는 우리나라 2030 국가 온실가스 감축 로드맵 수정안의 기준년인 2017년를 기준으로 하여 대한민국 환경산업연관표(Republic of Korea Environmentally Extended Input-Output Table, ROKEEIOT)를 만들었다. 또한, 이 표를 이용하여 경제활동별 온실가스 배출특성을 Scope 1, Scope 2 및 Scope 3로 나누어 상세히 분석하고, 최종수요 항목에 의한 온실가스 배출특성을 확인하였다. 본 연구에서 제안된 ROKEEIOT의 작성과 분석방법은 향후 경제활동에 따른 산업별 특성을 반영한 기후변화 대응, 미세먼지와 같은 대기 오염물질 대책 등과 같이 경제활동과 연계한 실효성 있는 환경정책 수립에 다각적으로 활용될 것으로 기대된다.
2. 에너지 수급 및 국가 온실가스 배출량 현황
2.1. 2017년 에너지 수급현황
통상 일정기간 동안 국가 에너지 수급에 대한 정량적인 정보를 담고 있는 에너지 통계를 에너지밸런스라고 한다. 과거에는 에너지 통계의 주요 목적이 단순히 에너지의 수급상황을 파악하기 위해서 였다면 현재는 기후변화 대응, 에너지 효율향상 등 우리나라가 직면한 과제를 해결하는 정책의 입안과 정책평가의 기초자료로 활용되는 것으로 변화되어 왔다[26]. 우리나라는 1983년부터 “에너지통계연보 ”를 발간하면서 에너지밸런스를 작성하였다[26]. 처음에는 40열 33행의 에너지밸런스가 작성되었으나, 이후 석유제품 분류를 확대하고, “가정· 상업부문”을 “가정”과 “상업” 부문으로 분리함으로써 2017년 현재는 41열 37행의 에너지밸런스를 작성하고 있다[26]. 이렇게 작성된 에너지밸런스는 부문별 연료 소비량을 확인할 수 있어 연료별 탄소배출계수를 이용하여 산업부문별 탄소배출량을 추정할 수 있다. 또한 국가 온실가스 인벤토리 작성시 에너지 산업부문의 활동자료로 이용되고 있다[7]. 그러나, 현재 발표되는 에너지밸런스는 우리나라의 에너지 수급 현황을 반영하기엔 한계가 있어 2017년부터 국제 기준에 부합하는 수준의 에너지밸런스를 개발하기 시작하였으며, 현재 1990년 이후의 시계열을 구축하여 국가 에너지 통계정보 종합시스템(KESIS)에 개정 에너지밸런스를 구축하고 결과와 설명자료를 공개하고 있다[27].
Table 1는 2017년 에너지밸런스[28]를 나타낸 것이다. 에너지밸런스의 값은 에너지원의 발열량에 기초하여 석유의 발열량으로 환산한 석유환산톤 (Ton of oil equivalent, 이하 ‘TOE’) 단위로 표시된다. 에너지밸런스는 석탄, 석유, 천연가스 등의 에너지원을 열방향에 나타내고 에너지원의 생산과 수입 등을 포함한 공급부문과 1차 에너지 공급과 최종에너지 소비 부문을 행방향에 작성한다. 에너지원은 국내생산과 수입되는 양에서 수출, 국제벙커링는 양을 빼고 재고 증감과 통계오차를 포함하여 1차 에너지 공급으로 이루어진다. 이렇게 공급된 에너지는 에너지전환 과정을 거처 최종에너지로 소비된다. 최종에너지 소비는 산업부문(농림어업, 광업, 제조업, 건설업), 수송, 가정, 상업 및 공공부문 등에서 사용하는 최종에너지 소비로 구분되어 있다. Table 1에 나타난 바와 같이 석탄, 석유, LNG, 수력, 원자력 및 신재생 에너지로 1차 에너지 공급은 각각 86 M TOE (Mega TOE), 120 M TOE, 48 M TOE, 1.5 M TOE, 32 M TOE, 16 M TOE이 공급되어 총 302 M TOE가 1차 에너지로 공급되었다. 에너지 전환부문에 사용된 에너지는 석탄, 석유, LNG, 수력, 원자력 및 신재생 에너지로 각각 53 M TOE, 1.5 M TOE, 46 M TOE, 1,5 M TOE, 32 M TOE, 7.2 M TOE이 사용되어, 도시가스 23 M TOE, 전력 44 M TOE과 열에너지 2.4 M TOE를 생산하였다. 최종에너지 소비에는 석탄, 석유류, LNG, 도시가스, 전력, 열에너지 및 신재생 에너지가 각각 33 M TOE, 118 M TOE, 1.4 M TOE, 23 M TOE, 44 M TOE, 2.4 M TOE, 및 8.6 M TOE으로 총 231 M TOE가 공급되어 산업영역에서 사용되고 있다.

2.2. 국가 온실가스 배출량 산정방법 및 배출량
환경부는 유엔기후변화협약 규정에 따라 소관 분야의 배출량 산정, 배출‧흡수 계수의 개발 등을 위임 받아 정부기관 및 공공기관에서 발표하는 다양한 자료를 활용하여 매년 해당영역에서의 온실가스 배출량을 산정하고 있다[7]. 온실가스 배출량 산정에 관한 국가 온실가스 인벤토리 보고서에서는 인간 활동으로 발생되는 교토의정서에서 규정한 6대 직접 온실가스인 CO2, CH4, N2O, HFCs, PFCs, 및 SF6 의 배출·흡수량을 보고하고 있다[7]. 온실가스(Greenhouse gases, GHGs)는 종류에 따라 대기 잔류 기간 동안 방열 수준이 서로 다르므로 배출량의 수준 파악 및 상호비교를 위하여 지구온난화지수가 고려된 CO2 환산량(Carbon dioxide equivalent, 이하 ‘CO2eq.’)으로 산정한다[7]. 국가 온실가스 인벤토리의 에너지 연료연소에서 발생하는 온실가스 배출은 에너지산업, 제조업 및 건설업, 수송, 기타, 미분류 부문으로 구분되며 석탄, 석유, 천연가스 등과 같은 화석연료의 연소로 인해 배출되는 온실가스인 CO2, CH4 및 N2O에 대하여 산정되고 있다[7]. 에너지 연료연소 부문의 활동자료는 국가 에너지 통계인 수록된 에너지밸런스의 부문별 연료 소비량을 활용하는데, 에너지밸런스는 제조업 부문의 수입 무연탄이 세부 업종별 자료 없이 총량으로만 제공하고 있다는 문제점이 있다[7]. 에너지 분야의 온실가스 인벤토리는 1996 IPCC GL에서 제시한 부문별 접근법에 기초하며, 연료연소에 의한 CO2 발생량은 국가 고유탄소배출계수와 전환계수를 적용하여, 아래 식을 이용하여 계산하고 있다[7].
여기서, Emission는 이산화탄소 배출량(1000ton), TAij은 연료 사용량(1000TOE), FCSij 은 탄소몰입율, 41.868은 Joule-TOE 환산계수(TJ/1000TOE), CFi은 전환계수(순발열량/총발열량), EFi은 배출계수(tC/TJ), OFi은 산화율, 44/12은 탄소기준 배출량을 이산화탄소 기준으로 전환(kg CO2/kg C), i은 연료 유형, j은 부문이다.
Fig. 1는 1990년부터 2019년까지의 연도별 온실가스 배출량[29]을 현재가격에 대한 GDP [30]와 함께 나타냈다. 1990년 온실가스 총 배출량은 292,098 kt (kilo ton) CO2eq.이였으며, 1998년 외환위기를 겪으면서 온실가스 배출량은 전년도에 비해 70,488 kt CO2eq. 감소하였다. 이후 2014년에 온실가스 배출량이 전년도보다 감소되었지만 미미하였으며, 2019년에 온실가스 배출량은 전년도보다 25,675 kt CO2eq. 감소하였다. 전체적으로 GDP 성장과 연계하여 온실가스 배출량이 변하고 있으며, 경제성장의 변화에 비해 온실가스 배출량의 변화량이 안정화되고 있음을 보여주었다.

Table 2는 국가 온실가스 인벤토리의 2017년 부문별 온실가스 배출량[29]을 정리한 것이다. 한국의 2017년 온실가스 총 배출량은 709 Mt (Mega ton) CO2eeq.이다. 분야별로는 에너지 분야에서 616 Mt CO2eq.(86.8%), 산업 공정 분야의 배출량은 56 Mt CO2eq.(7.9%)이며, 농업 분야는 20 Mt CO2eq.(2.9%), 폐기물 분야는 17 Mt CO2eq.(2.4%)의 온실가스를 배출하였고 LULUCF분야에서 42,557 Mt CO2eq.이 흡수되어, 순배출량은 668 Mt CO2eq.이다. 온실가스 성분 별 총 배출량은 CO2는 650 Mt CO2eq.(91.5%), CH4 은28 Mt CO2eq.(3.9%), N2O는 14 Mt CO2eq.(2.0%), HFCs는 9.6 Mt CO2eq.(1.4%), PFCs는 2.1 Mt CO2eq.(0,3%), SF6 은 7.0 Mt CO2eq.(1.0%)이 배출되었다. CO2, CH4와 N2O의 경우 에너지, 산업공정, 농업, LULUCF, 폐기물 분야에서 발생되고 있지만 HFCs, PFCs, 및 SF6 의 경우 산업공정에서 발생되며, 주로 반도체제조과정에서 발생되는 것으로 보고되고 있다.

3. 분석 방법 및 자료
3.1. 사용 자료
환경산업연관표는 산업연관표와 환경부속표 2부문으로 구성되어 있다. 산업연관표는 한국은행에서 발표하며, 5년마다 실측표가 작성되고 이를 근거로 연장표가 작성되어 일정기간(1년)동안 각 우리나라의 경제주체와 산업 간의 제품과 서비스의 거래내역을 정리한 것이다[27,28]. 환경부속표는 자원소비, 환경 오염물질 배출, 폐기물 발생 등을 나태낸다. 본 연구에서 작성된 2017 ROKEEIOT는 환경부속표에 온실가스 배출량을 나타내며 다음의 4가지 주요한 자료를 기반으로 작성하였다. 첫번째 자료는 2017년 산업연관표로 기본부문(381개 부문)과 대분류(33개 부문)이다[31]. 두번째 자료는 1년동안 경제주체에서 사용하는 에너지를 1차에너지와 최종에너지로 나누고, 에너지원 종류별로 사용량을 정리한 국가 에너지 통계 종합 정보시스템의 에너지밸런스[28]이다. 여기서 사용된 에너지밸런스는 27여 개의 에너지원 사용량이 경제 전반을 아우르는 20 여개의 경제 부문으로 나누어 정리되어 있는 표이다. 세번째 자료는 에너지 소비에 따른 이산화탄소 배출량을 계산할 수 있는 자료로 2017년 발열량 기준인 국가 고유탄소배출계수(탄소배출계수)[32], 일부 에너지원의 탄소몰입률[33-36]이다(Appendix 1). 네번째 자료는 환경부 산하의 한국 온실가스 정보센터에서 발표하는 2017년 국가 온실가스 인벤토리 자료[29]이다.
3.2. 환경산업연관표 작성
기존의 산업연관표(Z,f,X,V)에 에너지밸런스(E), 연료별 CO2 계수(P), 에너지밸런스 기반의 이산화탄소 배출량과 국가 온실가스 인벤토리 데이터를 이용하여 산출한 경제활동별 온실가스 배출량 (D)을 환경부속표로 나타낸 환경산업연관표는 Fig. 2와 같이 나타낼 수 있다.

Structure of the environmentally extended input-output table.
산업연관표의 총산출은 잔폐물이 없을 경우 중간수요(Z)와 최종수요(f)의 합으로 나타낼 수 있다. 즉, Z + f = X이며, 이 수급방정식의 Z를 총 산출 X로 나눈 값을 투입계수(A = Z/X) 라 하며, 투입계수는 생산물 1단위 생산에 필요한 중간재의 투입비중을 나타내는 비율을 나타낸다. 따라서, AX + f = X이고, X에 대하여 정리하면 X = (I - A)-1f가 된다. 여기서, I는 단위행렬을 나타내며, (I - A)-1는 Leontief역행렬인 생산유발 계수로 최종수요 한 단위 증가에 의해 각 산업부문에서 직간접적으로 유발되는 생산액을 나타낸다. 본 연구에서 이용하는 생산유발계수는 국산과 수입을 구분하지 않는 경쟁수입형 국산거래표의 투입계수(A)로부터 도출한 생산유발계수로 (I - A)-1를 이용하였다.
본 연구에서 작성된 ROKEEIOT는 산업연관표의 형식을 기반으로 하며, 3가지 가정조건이 있다. 첫째, 국가 고유탄소배출계수가 있는 에너지원을 대상으로 탄소몰입율을 고려하고 연소율 100%로 하여 이산화탄소 배출량을 계산한다. 둘째, 기본 부문으로 분류되는 신재생에너지의 경우 전력생산에 한정된 신재생에너지를 의미한다. 그러나 신재생에너지는 에너지 균형 측면에서 신재생에너지와 전기생산 이외의 기타 에너지 생산으로 구분되기 때문에 자료간의 연관성이 떨어지는 부분이 있으나 이러한 부분은 고려하지 않는다[23]. 셋째, 유사 산업에서의 에너지원의 가격은 동일하다. 예를 들어, 수력, 화력, 원자력, 자가발전, 신재생에너지, 증기 및 온수 공급부문을 전력 발전부문(전력 및 신재생에너지와 증기 및 온수 공급업)으로 통합하여 하나의 산업으로 하였다. 이에 전력발전부문은 해당부문들의 값을 모두 더하여 작성되기 때문에 계산시에 평균값이 적용된다. 이렇게 작성한 ROKEEIOT는 매년 발간되는 산업연관표와 에너지밸런스를 이용하고 있어 주기적인 작성이 가능하며, 경제활동별 에너지흐름과 그에 따른 이산화탄소 배출량을 알아보기 쉽다. 산업연관분석을 적용하여 경제주체들이 사용하는 직접 및 간접적인 에너지 사용량 및 온실가스 배출량을 확인할 수 있다. 더 나아가, 특정 산업에서 유도되는 에너지 및 온실가스 발생량을 추정하고 발생량 핫스팟을 파악하여 각 산업부문이 미치는 경제활동과 환경에 미치는 영향을 분석할 수 있다.
ROKEEIOT에 온실가스 배출량표는 이전 연구에서 사용된 방식들을 참고하여 작성하였다[22-24]. 산업부문은 기본부문으로 에너지를 할당한 후 산업연관표의 산업부문과 에너지밸런스의 산업부문을 경제활동에 따른 영향을 평가할 수 있도록 부문을 재조정하였다. 우선, 온실가스 프로토콜 분류에 따라 Scope 2에 해당하는 전력 및 신재생에너지와 증기 및 온수 공급을 하나의 산업으로 분류[37]하고자, 기존의 산업연관표 대분류의 전력, 가스 및 증기와 수도, 폐기물처리 및 재활용서비스 산업부문을 전력 및 신재생에너지와 증기 및 온수공급, 가스 및 수도, 그리고 폐기물처리 및 재활용서비스 3개의 산업 부문으로 재 분류하였다. 또한 산업연관표 대분류 중 종이와 목재를 하나의 산업으로 통합하였으며, 운송서비스 부문을 운송과 운송서비스의 부문으로 나누어 총 35개 부문으로 산업 연관표를 조정하였다(Appendix 2). 그 후 에너지밸런스의 산업부문을 산업연관표의 경제부문에 맞추어 재분류하고, 산업의 경제활동에 의한 산업별 이산화탄소 배출량은 에너지원별 소비량과 이산화탄소 배출계수를 이용하여 다음과 같이 산출하였다(식 (2)).
여기서, Pc은 이산화탄소 배출계수, ER,C는 각 경제활동별 총 에너지 소비량, DR,E은 경제활동별 에너지원에 따른 이산화탄소 배출량이다.
ER,C는 각 경제활동별 에너지 총 소비량으로 경제활동에 의한 산업별 에너지 소비량과 이와 연관된 수송부문을 합하여 식 (3)과 같이 구하였다.
여기서, ER,E는 경제활동별 에너지 소비량, ER,T는 경제활동별 도로수송부문(가솔린과 디젤)의 에너지 소비량이다.
ER,E를 구하기 위해서는 에너지 소비량을 산업으로 할당시키는 과정이 필요하다. 에너지밸런스 상에는 에너지원의 산업별로 나타나 있지만 산업연관표의 산업과 맞지 않아, 에너지 소비량을 산업연관표의 기본부문과 매칭시켜 381부문에 할당하여 산업별 에너지 소비량을 계산하였다. 무연탄의 경우, 에너지밸런스의 산업부문에 해당되는 산업에 대하여 할당하여 경제활동별 소비량을 계산하였다.
여기서, EE는 에너지 소비량, xj은 산업연관표에서 에너지원 i에 대한 산업부문 j에 대한 판매량,
도로수송부문은 전 산업에서 사용하는 가솔린과 디젤을 통합하고 있어 산업별 에너지 사용에 대한 영향을 정확히 파악할 수 없다[38-40]. 따라서, 전체 산업과 가정에서 가솔린과 디젤의 가격은 동일한 것으로 가정하고, 각 산업과 가정에 대한 도로수송부문(가솔린과 디젤)의 에너지소비량을 도로수송부문의 에너지소비량에 각 경제활동에 따른 산업의 배분구조 비를 곱하여 아래 식으로 산출하였다.
여기서, ET는 도로수송부문(가솔린과 디젤)에 에너지소비량, xj(Total) 은 산업연관표에서 에너지원 i에 대한 산업부문 j에 대한 판매량,
예를 들어, 금속가공제품부문에 대하여 살펴보면, 산업연관표(기본부문)의 금속 주물에서 기타 금속 제품까지 15개 세부 부문에 해당된다. 금속가공제품업에 대하여 무연탄, 도로수송용 가솔린과 도시가스에 대한 배분구조에 따른 판매내역과 에너지 소비량과 그에 따른 이산화탄소 배출량을 Table 3과 같다. 무연탄에 대하여 먼저 살펴보면, 2017년 산업부문에서 3,473,400 TOE을 소비하여 14,888 kt CO2를 발생되는 것으로 추정된다. 에너지밸런스 산업부문은 산업연관표(기본부문)의 벼에서 기타 건설업 사이의 상업부문을 제외한 286개 세부 부문에 해당된다. 산업부문에서 무연탄을 이용하기 위하여 판매된 금액은 997,481 mil. (Million) KRW으로 나타났으며, 금속가공제품업에서 판매된 금액은 4,458 mil. KRW이었다. 이 금액은 해당 산업부문의 0.45%에 해당하며, 앞서 설명한 바와 같이 에너지원의 가격은 유사 산업에서 동일하다는 가정으로 14,888 kt CO2의 0.45%인 67 kt CO2가 발생되는 것으로 추정된다. 다음으로 도로수송용 가솔린을 살펴보면, 2017년 산업 부문(381)과 가정부문에서 총 9,616,700 TOE를 소비하여, 27,355 kt CO2가 발생되는 것으로 추정된다. 가솔린이 판매된총 금액은 17,257,096 mil. KRW으로 금속가공제품업에서 판매된 금액은 106,806 mil. KRW으로 총 금액의 0.006%에 해당된다. 앞서 설명한 바와 같이 에너지원의 가격은 유사 산업에서 동일하다는 가정으로 27,355 kt CO2의 0.006%인 169 kt CO2가 발생되는 것으로 추정된다. 마지막으로 도시가스에 대하여 살펴보면, 2017년 금속가공제품업이 1,655,100 TOE를 소비하여 3,513 kt CO2가 발생되는 것으로 추정된다. 같은 할당 방법으로 금속가공제품업의 세부 부문에 대한 발생량 추정해보면 Table 3과 같다.

Purchasing price, energy consumption and carbon dioxide emission in the processing metal products sector.
본 연구에서는 에너지밸런스와 탄소배출계수를 이용하여 에너지 관련 CO2 배출량(예: 석탄, 천연 가스 및 석유)만 계산하였으며, CH4, N2O, HFCs, PFC 및 SF6 을 국가 온실가스 인벤토리의 2017년 배출량을 이용하였다. 그러나, LULUCF 부문과 메탄의 연료연소 중 고체연료 제조 및 기타 에너지 산업과 미분류부문과 탈루, 아산화질소 연료연소 중 고체연료 제조 및 기타 에너지 산업과 미분류부문을 제외하고 계산하였다. 또한, 이산화탄소의 산업공정 중 소다회 생산 및 소비, 금속산업의 철강생산과 HFCs의 산업공정 중 할로카본 및 육불화학 소비 기타(잠재배출량)부문도 제외하였는데, 이는 정확이 어떤 산업에서 배출되는지 알기 어렵거나 잠재배출량으로 배출되는 것으로 추정하여 계산하였기 때문이다.
에너지원과 연관이 있는 CH4 및 N2O 배출량을 각 산업에 할당하기 위하여 위의 식 (4)에 따라 각 산업에 할당된 에너지 소비량(또는 산정된 CO2 배출량)에 비례하여 각 부문에 할당하여 계산하였다. 그 외 에너지원과 연관이 없는 폐기물, 석회 생산등의 배출량을 할당할 때는 총 산출액에 비례하여 각 해당 산업부문에 할당하였다. 불소 가스에는 HFCs, PFC 및 SF6 이 포함되며 반도체 제조, 중전기기, 마그네슘 생산에 의해 발생하는 것으로 할당하였다. 농업 가축부문 중에 젖소[41]와 육우[41]의 가축 수를 확인하여 할당하는 작업을 실시하였다. 이렇게 경제활동별로 발생된 온실가스 배출량을 기본부문에서 추정하고 35개 부문으로 조정한 산업연관표로 통합하여 각 경제활동별 직접적으로 발생되는 온실가스 배출량을 추정하였다. 그 후, 직접적인 온실가스 배출량을 총 산출액으로 나누어 각 산업에서 경제활동별 발생되는 온실가스 배출계수(배출 원단위, 백만원당 발생되는 온실가스 배출량, GHGs intensity)을 도출하였다.
3.3. 환경산업연관분석
경제활동별 발생된 온실가스 배출량은 경제활동별 온실가스 배출계수와 총 산출액을 이용하여 식 (6)으로 계산할 수 있었다.
여기서, D는 온실가스 배출량이며, C는 경제활동별 온실가스 배출계수, X는 경제활동별 총 산출액을 의미한다. 본 연구에서 각 경제활동의 온실가스 배출계수는 환경부속표의 온실가스 배출량(D)을 총 생산량(X)로 나누어 구하였다.
식 (6)의 X에 (I - A)-1f를 대입하면 최종수요에 의해 생성된 직접 및 간접 배출량을 포함한 경제활동별 온실가스 총 배출량을 구할 수 있다.
여기서, T는 온실가스 총 배출량을 말하며, C(I - A)-1 는 경제활동별 최종수요에 의한 온실가스 배출의 직·간접적 파급 효과를 포함하는 온실가스 배출유발계수(Total GHGs intensity) 이다.
식 (7)의 Leontief역행렬을 전개하면 온실가스 총 배출량은 식 (8)로 나타낼 수 있었다.
여기서, 우변은 최종수요에 의한 순차적영향을 나타내는 것으로 공급망 및 가치사슬에 의한 온실가스 배출의 파급효과를 보여주고 있다[42,43]. Cf는 f에 대한 수요로 인하여 발생되는 직접 배출량으로 Scope 1 배출량을 말한다. CAf는 각 부문의 최종수요 1단위를 생산하는데 필요한 중간 투입(자원, 전력, 증기 및 열 등)으로 전력 및 신재생에너지와 증기 및 온수 공급만을 고려하면 Scope 2 배출량이 된다(식 (9)). 따라서, 총배출량에서 직접 배출량(Cf)와 scope 2를 뺀 나머지가 Scope 3가 된다(식 (10)).
위 식에서, Ce는 전력 및 신재생에너지와 증기 및 온수공급 산업에 대한 온실가스 배출계수, Aej는 j부문의 최종수요 한 단위를 충족하기 위하여 간접적으로 필요한 전력 및 신재생에너지와 증기 및 온수 공급산업의 산출단위를 의미한다.
또한, 최종수요(f)를 식 (11)과 같이 소비, 투자 및 수출로 나누면 최종수요 항목별로 온실가스 배출에 미치는 영향을 분석할 수 있었다.
위 식에서, fc는 소비수요, fi는 투자수요, fe는 수출수요이다.
최종수요 항목별 온실가스 배출유발효과를 나타내는 최종 수요 항목별 온실가스 배출유발계수는 앞의 식 (11)를 통해 구한 최종수요 항목별 배출 유발량에 최종수요액을 나누어 아래와 같이 구하였다.
4. 결과 및 고찰
4.1. 경제활동별 온실가스 배출량
Table 4은 경제활동별 온실가스 배출량을 분석하기 위하여, 2017년 국가 온실가스 인벤토리 기반의 이산화탄소 배출량[29], 에너지밸런스 기반의 이산화탄소 배출량, ROKEEIOT의 경제 활동별 이산화탄소 배출량을 비교하여 정리하여 나타내었다. Table 4의 A는 국가 온실가스 인벤토리 기반의 이산화탄소 배출량이며, B는 에너지밸런스의 연료사용량에 배출계수를 곱하여 계산한 이산화탄소 배출량으로 산업공정의 무연탄의 값을 기타 제품군에 포함하여 계산하고, 수송부문에 대하여 할당하지 않았을 경우에 대하여 나타내었다. C는 무연탄과 수송부문에 대하여 산업공정에 할당 한 이산화탄소 배출량을 나타낸 것으로, 식 (3)과 같이 산업 전반에서 수송에 의한 자재의 공급 등을 반영하여 가솔린과 디젤을 전 산업공정에 할당하여 나타내었다. D의 경우 에너지밸런스의 연료를 381개 부문에 할당한 후 재 분류 된 35개의 경제활동에 따른 값을 정리하여 나타낸 ROKEEIOT의 이산화탄소 배출량을 의미한다. 재 분류 된 35개의 경제부문에서 종이와 목재를 하나의 경제활동으로 표기하였다.

Comparison of carbon dioxidw emissions of national inventory and ROKEEIOT.
A의 경우 에너지산업에서 267,967 kt O2eq., 제조업 및 건설업에서 185,959 kt CO2eq., 수송에서 97,596 kt CO2eq., 기타에서 51,881 kt CO2eq.배출되었다. B의 경우 에너지산업에서 256,662kt CO2eq., 제조업 및 건설업에서 195,029 kt CO2eq., 수송에서 120,045 kt CO2eq., 기타업종에서 49,902 kt CO2eq. 배출되었다. C의 경우 에너지산업에서 257,486 kt CO2eq., 제조업 및 건설업에서 204,223 kt CO2eq., 수송에서 58,032 kt CO2eq., 기타업종에서 101,897 kt CO2eq.배출되었다. D의 경우에는 할당한 후 에너지밸런스 기반의 이산화탄소 배출량(C)와 같이 에너지산업에서 257,486 kt CO2eq., 제조업 및 건설업에서 204,223 kt CO2eq., 수송에서 58,032 kt CO2eq., 기타업종에서 101,897 kt CO2eq.배출되었다. 요약하면, 에너지 연소 따른 이산화탄소 총 배출량은 국가 온실가스 인벤토리에서 공시되는 값과 본 연구에서 에너지밸런스 표를 이용하여 계산된 값의 차이가 2%로 매우 미비하여, 에너지 밸런스에 기반한 ROKEEIOT로 온실가스 추정하는 것의 유효성을 확인할 수 있었다. 특히, 국가 온실가스 인벤토리 기반의 부문별 이산화탄소 배출량(A), 에너지밸런스에 기반하여 무연탄과 수송부문을 할당한 부문별 이산화탄소 배출량 (C), ROKEEIOT의 경제활동별 이산화탄소 배출량(D)을 살펴보면 수송부문과 기타제조, 상업과 공공과 가정, 농업, 임업 및 어업을 포함하고 있는 기타 부문에서 값이 변화되어, 경제활동에 따른 영향을 파악하기 위해서는 본 연구에서 제시한 것과 같이 산업연관표에 맞도록 경제활동별 조정과 할당이 필요함을 보여주었다.
에너지밸런스는 제조업 부문의 수입 무연탄이 세부 업종별 자료 없이 총량으로 제공하고 있으며 이를 국가 인벤토리 산정 시에는 기타제조업으로 구분하고 업종별 자료 확보 시 기타제조업에서 차감하여 해당 업종에 재분배하고 있다[29]. 산업 연관표에서 무연탄 부문의 배분구조를 살펴보면 철강, 비철금속, 조립금속 등에서 판매된 것을 확인 수 있다[31]. 업종별 자료 확보가 어려울 경우 산업에서 원재료의 구입 또는 생산물의 판매내역으로 무연탄을 소비하는 업종이 확인 가능할 것으로 판단된다. 또한, 수송과 관련된 온실가스 인벤토리의 경우 광업, 제조업, 건설업 등 산업계의 수송용도 연료소비에 의한 배출량은 산업계의 배출량으로 포함하여 공시되고 있다[29]. 그러나, 에너지밸런스 작성시 건설 현장 및 산업체 내에서의 이동은 산업부문 연료 소비이지만 외부로 이동할 경우 수송 부문에 포함하여 공시되고 있다[44]. 산업체에서 다른 산업체로의 운송되어 원자재, 원료 등으로 이용되기 때문에 수송 부문보다 산업체에서 이용하는 부분으로 할당하는 것이 적절하다고 판단된다.
4.2. 경제활동별 총 산출액과 온실가스 배출량
경제활동에 따른 경제활동별 온실가스 배출량의 기여도를 비교하기 위하여 경제활동별 경제의 기여율과 온실가스 배출 기여율을 정리하여 Fig. 3에 나타내었다.

Contribution of economic and greenhouse gases emissions by economic sectors.
Agriculture (1), Mining Products (2), Groceries and Beverages (3), Fiber and Leather Products (4), Wood, Paper, and Printing Products (5), Coal and Petroleum Products (6), Chemical Products (7), Nonmetallic Minerals Products (8), Primary Metal Products (9), Processing Metal Products (10), Computer, Electronic, and Optical Instruments (11), Electrical Equipment (12), Machines and Equipment (13), Transportation Equipment (14), Other Manufacturing Products (15), Manufacturing and industrial equipment repair (16), Electricity, Steam, Chilled or Hot water and Air conditioning supply (17), Gas and distributions of gaseous fuel through mains and Water supply (18), Wastewater, and Recycling Service (19), Construction (20), Wholesale, Retail, and Commodity Brokerage Services (21), Transportation (22), Transportation Service (23), Restaurants and Accommodation (24), Information Communication and Broadcasting Services (25), Financial and Insurance Services (26), Real Estate Service (27), Professional, Science and Technical Services (28), Business Support Service (29), Public administration and defense, and Social Security (30), Education Service (31), Health and Social Welfare Services (32), Services for Art, Sports and Leisure (33), Other Services (34), Others (35)
그림에서와 같이 경제적인 기여도가 높은 3개 산업부문은 11번 산업(7.8%), 20번 산업(6.6%), 21번 산업(6.5%)으로 전체의 20.9%를 기여하고 있다. 하지만 이 부문들의 온실가스 배출량은 각각 1.3%, 0.9%, 1.4%로 전체의 3.6%로 매우 낮은것으로 나타났다. 온실가스 배출량의 기여도가 높은 3개 산업 부문은 17번 산업(39.6%), 9번 산업(17.7%), 22번 산업(8.8%)으로 전체의 66.0%를 기여하는 것으로 나타났다. 하지만 이 부문들의 총 산출액의 기여도는 각각 1.6%, 3.2%, 2.3%로 전체의 7.2%로 매우 낮은 것으로 나타나, 경제적 기여도와 온실 가스 배출량 기여도가 서로 매우 상이함을 보여주었다.
Table 5은 경제부문별 총 산출액 및 온실가스 배출량을 이용하여 온실가스 배출계수를 정리한 표이다. 온실가스 배출량이 높았던 3개 부문은 17번 산업, 9번 산업, 22번 산업이었다. 17번 산업의 경우 산출액은 67,742 Bil.(Billion) KRW, 온실가스 배출량은 262,280 kt CO2eq.으로 온실가스 배출계수는 3.87 ton CO2eq./mil. KRW으로 나타났다. 9번 산업의 경우 산출액 135,178 Bil. KRW, 온실가스 배출량은 117.098 kt CO2eq. 으로 온실가스 배출계수는 0.87 ton CO2eq./mil. KRW으로 나타났다. 22번 산업의 경우 산출액 96,142 Bil. KRW, 온실가스 배출량은 58,332 kt CO2eq.으로 온실가스 배출계수는 0.61 ton CO2eq./mil. KRW 으로 나타났다. 온실가스 배출계수가 높았던 3개 부문은 17번 산업, 8번 산업, 19번 산업이었다. 17번 산업의 경우 온실가스 배출량은 많지만, 총 산출액이 적어 온실가스 배출계수는 높게 나타났다. 8번 산업의 경우 43,764 Bil. KRW으로 온실가스 배출량은 44,589 kt CO2eq.으로 온실 가스 배출계수는 1.02 ton CO2eq./mil. KRW 인 것으로 나타났다. 19번 산업의 경우 18,154 Bil. KRW으로 온실가스 배출량은 18,366 kt CO2eq.으로 온실가스 배출계수는 1.01 ton CO2eq./mil. KRW인 것으로 나타났다.

Total output, greenhous gas emissions and green- house gases intensity by economic sectors.
2012년 한국환경정책·평가연구원 보고서에 따르면 전력·가스 및 수도의 온실가스 배출계수는 2005년 3.96 ton CO2eq./mil. KRW, 2009년 4.45 ton CO2eq./mil. KRW 인 것으로 보고하였다[45]. 이 연구 결과와 본 연구 결과를 살펴볼 때 2005년에서 2009년 사이의 배출계수는 3.96 ton CO2eq./mil. KRW 에서 4.45 ton CO2eq./mil. KRW로 증가하다가 2009년에서 2017년 사이의 배출계수는 4.45 ton CO2eq./mil. KRW 에서 3.87 ton CO2eq./mil. KRW로 감소되는 추세임을 알 수 있다. 이러한 결과는 화력발전의 효율 향상을 위한 연구, 신재생에너지 발전의 확대 및 석탄사용의 비중을 감소시키기 위한 다년간의 노력에 의한 결과로 사료된다[46].
또한, 국내에서 수행된 건설부문의 온실가스 배출량 산정 및 배출 특성 연구에 따르면 2017년 건설업의 약 0.02 ton CO2eq./mil. KRW(건설수주액 기준)으로 본 연구의 결과와 유사한 결과를 보여주었다[47].
4.3. 경제활동별 Scope 1, Scope 2 및 Scope 3 온실가스 배출량 및 배출특성
Fig. 4은 온실가스 배출량을 Scope 1, Scope 2 및 Scope 3 배출량으로 나누어 경제활동별로 나타낸 것이다. 직접배출인 Scope 1의 배출량이 높은 3개 산업부문은 17번 산업(36,527 kt CO2eq.), 9번 산업(35,832 kt CO2eq.)과 22번 산업(30,785 kt CO2eq.)이였다. 전력 및 신재생에너지와 증기 및 온수 공급업 사용에 의한 Scope 2의 배출량이 높은 3개 산업부문은 28번 산업(11,891 kt CO2eq.), 7번 산업(10,569 kt CO2eq.)과 31번 산업(10,016 kt CO2eq.)순으로 나타났다. Scope 3의 배출량이 높은 3개 산업부문은 20번 산업(142,733 kt CO2eq.), 14번 산업(106,344 kt CO2eq.)과 11번 산업(90,921 kt CO2eq.)순으로 높은 것으로 나타났다. 총 배출량은 20번 산업(151, 476 kt CO2eq.), 14번 산업(112,168 kt CO2eq.)과 11번 산업 (107,868 kt CO2eq.)순으로 높게 나타났다.

Greenhous gases emissions by scope.
Agriculture (1), Mining Products (2), Groceries and Beverages (3), Fiber and Leather Products (4), Wood, Paper, and Printing Products (5), Coal and Petroleum Products (6), Chemical Products (7), Nonmetallic Minerals Products (8), Primary Metal Products (9), Processing Metal Products (10), Computer, Electronic, and Optical Instruments (11), Electrical Equipment (12), Machines and Equipment (13), Transportation Equipment (14), Other Manufacturing Products (15), Manufacturing and industrial equipment repair (16), Electricity, Steam, Chilled or Hot water and Air conditioning supply (17), Gas and distributions of gaseous fuel through mains and Water supply (18), Wastewater, and Recycling Service (19), Construction (20), Wholesale, Retail, and Commodity Brokerage Services (21), Transportation (22), Transportation Service (23), Restaurants and Accommodation (24), Information Communication and Broadcasting Services (25), Financial and Insurance Services (26), Real Estate Service (27), Professional, Science and Technical Services (28), Business Support Service (29), Public administration and defense, and Social Security (30), Education Service (31), Health and Social Welfare Services (32), Services for Art, Sports and Leisure (33), Other Services (34), Others (35)
Fig. 5는 Fig. 4의 온실가스 배출량을 비율로 정리한 것이다. Scope별 비율을 산술 평균하여 살펴보면, 직접적인 오염물질 배출양을 나타내는 Scope 1의 배출량은 18%였으며, 기업이 사용하기 위해 구매하는 전력 및 신재생에너지, 증기 및 온수 생산에서 간접적으로 배출되는 Scope 2의 배출량은 12%으로 나타났다. 공급망 의해 발생하는 기타 배출량을 나타내는 Scope 3의 배출량은 69%으로 나타났다. 전체 온실가스 배출량을 Scope별 배출량에 대한 비율로 살펴보면 Scope 1이 16%, Scope 2이 9% 그리고 Scope 3이 75%으로 나타났다.

Contributions of scope 1, scope 2, and scope 3 emissions by economic sectors.
Agriculture (1), Mining Products (2), Groceries and Beverages (3), Fiber and Leather Products (4), Wood, Paper, and Printing Products (5), Coal and Petroleum Products (6), Chemical Products (7), Nonmetallic Minerals Products (8), Primary Metal Products (9), Processing Metal Products (10), Computer, Electronic, and Optical Instruments (11), Electrical Equipment (12), Machines and Equipment (13), Transportation Equipment (14), Other Manufacturing Products (15), Manufacturing and industrial equipment repair (16), Electricity, Steam, Chilled or Hot water and Air conditioning supply (17), Gas and distributions of gaseous fuel through mains and Water supply (18), Wastewater, and Recycling Service (19), Construction (20), Wholesale, Retail, and Commodity Brokerage Services (21), Transportation (22), Transportation Service (23), Restaurants and Accommodation (24), Information Communication and Broadcasting Services (25), Financial and Insurance Services (26), Real Estate Service (27), Professional, Science and Technical Services (28), Business Support Service (29), Public administration and defense, and Social Security (30), Education Service (31), Health and Social Welfare Services (32), Services for Art, Sports and Leisure (33), Other Services (34), Others (35)
건축물 등 건설상품의 경우 공급망상에 있는 제조단계에서 탄소 배출 비중이 90%이상으로 알려져 있다[48]. ROKEEIOT에 의해 계산 된 20번 산업인 건설업의 경우 Scope 1의 비율이 4%, Scope 2의 비율이 2% 그리고 Scope 3의 비율이 94%으로 나타났다. 한국의 경우는 아니지만 글로벌 식·음료회사 상위 100개 회사 중 Scope 3의 배출량을 공개하고 있는 회사의 경우를 살펴볼 때 Scope 3의 배출량이 평균적으로 총 배출량의 88% 를 차지하는 것으로 알려져 있다[49]. ROKEEIOT에 의해 계산된 3번 산업인 음식료품업의 경우 Scope 1의 비율이 4%, Scope 2의 비율이 7% 그리고 Scope 3의 비율이 89%으로 나타나 유사한 배출 특성을 보여주어, 환경산업연관 분석을 통하여 경제활동별 배출 특성을 파악할 수 있음을 알 수 있었다.
또한, 경제부문별로 보면 Scope 1이 50%를 넘는 산업은 6개, Scope 3이 50%를 넘는 산업은 29개로 나타나, 공급망 및 가치 사슬을 따라 발생되는 온실가스 배출량이 많다는 점을 알 수 있었다. 이상의 결과를 볼 때, 온실가스 감축 대책은 경제적 기여를 고려하고, 에너지 전환에서의 온실가스 감축과함께 경제부문별 자원 및 에너지효율개선을 통한 Scope 1, Scope 2 및 Scope 3 의 종합적인 감축전략을 수립하는 것이 필요함을 확인할 수 있었다.
이상에서와 같이 환경산업연관분석은 제품의 온실가스 배출량을 추정하는 프로세스기반의 전과정평가방법보다 정확도는 떨어지지만 해당 국가의 경제활동이 환경에 미치는 영향을 평가하는 유용한 방법임을 알 수 있다[50,51].
4.4. 최종수요에 의한 온실가스 배출특성
Table 6은 경제활동으로 인한 최종수요 항목별 온실가스 배출에 미치는 영향을 나타낸 것이다. 표에서와 같이 최종수요는 1,812,095 Bil. KRW였으며 소비, 투자, 수출이 각각 1,155,837 Bil. KRW(46.15%), 592,711 Bil. KRW(23.66%), 756,110 Bil. KRW(30.19%)으로 구성 되어있다. 최종수요에 의한 온실가스 배출 유발량은 소비, 투자 및 수출이 각각 425,711 kt CO2eq.(34.61%), 291,686 kt CO2eq.(23.71%), 512,781 kt CO2eq.(41.68%)으로 나타나 온실가스 감축전략에서 수출과 소비분야가 중요함을 보여주었다.
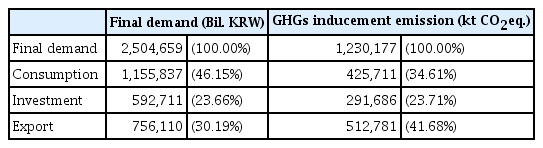
Greenhouse gases inducement emission by final demand factors.
최종수요에 의한 경제활동별 온실가스 총 배출량에 대한 배출특성을 파악하기 위하여 최종수요 항목별 배출유발계수를 식 (12)로 계산하여 Fig. 6에 나타내었다. 전체적으로 살펴볼 때, 소비에 의한 온실가스 배출유발계수는 0.170 ton CO2eq./mil. KRW, 투자에 의한 온실가스 배출유발계수는 0.116 ton CO2eq./mil. KRW, 수출에 의한 온실가스 총 배출유발계수는 0.205 ton CO2eq./mil. KRW으로 나타났다. 각 최종 수요에 따른 온실가스 배출유발계수 상위 3개 산업에 대하여 살펴보면, 소비에 의한 온실가스 배출유발계수는 32번 산업 (0.018 ton CO2eq./mil. KRW), 17번 산업(0.017 ton CO2eq./mil. KRW), 24번 산업(0.014 ton CO2eq./mil. KRW)순으로 서비스업에 의한 영향이 큰 것으로 나타났다. 투자에 의한 온실가스 배출유발계수는 20번 산업(0.060 ton CO2eq./mil. KRW), 13번산업(0.017 ton CO2eq./mil. KRW) 28번 산업(0.011 ton CO2eq./mil. KRW)순으로 나타났으며, 특히 20번 산업인 건설업이 투자에 특히나 큰 영향을 받는 것으로 나타났다. 수출에 의한 온실가스 배출유발계수는 9번 산업(0.040 ton CO2eq./mil. KRW), 11번 산업(0.035 ton CO2eq./mil. KRW) 7번 산업(0.030 ton CO2eq./mil. KRW)순으로 나타났다. 특히 14번 산업과 11번 산업이 수출에 특히나 큰 영향을 받는 것으로 나타났다. 전체적으로 온실가스 배출유발계수는 20번 산업(0.060 ton CO2eq./mil. KRW), 14번 산업(0.045 ton CO2eq./mil. KRW), 11번 산업(0.043 ton CO2eq./mil. KRW)순으로 나타나면서 건설업과 같이 파급효과가 큰 산업은 산업연관효과가 커 최종수요에 큰 영향을 받는 것으로 나타났다.

Total greenhous gases intensity by final demand.
Agriculture (1), Mining Products (2), Groceries and Beverages (3), Fiber and Leather Products (4), Wood, Paper, and Printing Products (5), Coal and Petroleum Products (6), Chemical Products (7), Nonmetallic Minerals Products (8), Primary Metal Products (9), Processing Metal Products (10), Computer, Electronic, and Optical Instruments (11), Electrical Equipment (12), Machines and Equipment (13), Transportation Equipment (14), Other Manufacturing Products (15), Manufacturing and industrial equipment repair (16), Electricity, Steam, Chilled or Hot water and Air conditioning supply (17), Gas and distributions of gaseous fuel through mains and Water supply (18), Wastewater, and Recycling Service (19), Construction (20), Wholesale, Retail, and Commodity Brokerage Services (21), Transportation (22), Transportation Service (23), Restaurants and Accommodation (24), Information Communication and Broadcasting Services (25), Financial and Insurance Services (26), Real Estate Service (27), Professional, Science and Technical Services (28), Business Support Service (29), Public administration and defense, and Social Security (30), Education Service (31), Health and Social Welfare Services (32), Services for Art, Sports and Leisure (33), Other Services (34), Others (35)
이상의 결과는 기후변화문제에 대응하기 위해서는 공급측면인 생산분야 뿐만 아니라 수요 측면인 소비 분야를 주도하는 가계부문과 와 수출부문에 대한 온실가스 저감 노력이 필요함을 보여주고 있다. 특히, 수출부문의 경우 기후변화 대응정책의 일환으로 유럽[52]과 미국[53]이 탄소국경 조정시스템의의 도입을 검토하고 있어, 향후 수입품에 탄소량배출량에 따라 관세가 부과될 예정이다[54]. 특히, 2017년 상위 10대 품목들인 반도체, 평판디스플레이 및 센서, 자동차, 컴퓨터[55] 등은 온실가스 배출 유발계수가 높았던 14번 산업과 11번 산업에 해당하는 산업부문에 포함된다. 이는 탄소국경조정제도가 전 산업에 도입될 경우 한국의 수출경제에 영향을 미칠것으로 예상되며, 해당 산업에 대하여 저탄소 경제로 전환등을 통해 탄소경쟁력을 강화시키기 위한 대응책 마련이 시급함을 보여주었다.
5. 결 론
경제활동과 환경정책을 연관시키기 위해서는 경제활동이 환경에 미치는 영향을 이해하는 것이 매우 중요하다. 본 논문에서는 우리나라에서 에너지사용에 의한 이산화탄소 배출량을 포함한 온실가스 배출량과 관련된 문제를 경제활동과 연계하여 평가할 수 있는 2017 ROKEEIOT를 작성하고, 경제활동별 온실가스 직접 배출계수와 생산과 수요 측면에서 온실가스 배출특성을 분석하여 다음과 같은 결론을 얻었다.
첫째, 본 연구에서 제시한 2017 ROKEEIOT 로 산출한 경제활동별 에너지연소에 따른 이산화탄소 배출량(621,638 kt CO2eq.)과 국가 온실가스 인벤토리의 에너지부문의 배출량(606,574 kt CO2eq.)는 2%내의 오차로 정부 통계자료치와 일치하여, 에너지밸런스와 산업연관표를 이용한 이산화탄소 배출량 산출은 경제활동별 이산화탄소 배출량을 산출할 수 있는 실효성 있는 방법임을 확인하였다. 또한, 이산화탄소 외의 온실가스를 국가 온실가스 인벤토리를 사용하여 추가할 경우, 경제활동과 온실가스 배출량을 연계할 수 있는 환경산업연관표를 작성할 수 있다.
둘째, 경제적 기여도는 11번 산업(컴퓨터, 전자 및 광학기기업), 20번 산업(건설업), 21번 산업(도소매 및 상품중개서비스) 순으로 높게 나타났다. 하지만 직접 온실가스 배출량은17 번 산업(전력 및 신재생에너지와 증기 및 온수 공급업), 9번 산업(1차 금속제품업), 22번 산업(운송업) 순으로, 온실가스 총 배출량은 20번 산업(건설업), 14번 산업(운송장비업), 11번산업(컴퓨터, 전자 및 광학기기업)순으로 높게 나타났다. 이는 경제적 기여도와 온실가스 배출특성, 온실가스 직접 배출량과 온실가스 총 배출량이 매우 상이함을 보여주는 것이다.
셋째, 온실가스 배출량을 구분한 결과, 직접적인 오염물질 배출량을 나타내는 Scope 1의 배출량이 50%를 넘는 산업은 6개, 공급망 및 가치사슬에 따른 오염물질 배출양을 나타내는 Scope 3의 배출량이 50%를 넘는 산업은 29개가 나옴에 따라, 공급망 및 가치 사슬을 따라 발생되는 온실가스 배출량이 많다는 점을 알 수 있었다. 따라서, 온실가스 배출량 저감 정책은 경제활동별 직접 배출뿐만 아니라, 공급망 및 가치사슬에 따라 발생되는 산업 전반의 간접배출이 반영되어야 함을 알 수 있었다.
넷째, 경제활동에 따른 온실가스 배출은 최종수요 항목인 소비, 투자, 수출에 의한 배출 유발량으로 부문별 기여율이 각각 34.61%, 23.71%, 41.68%으로 나타났다. 이는 기후변화 정책 수립 시 공급 측인 생산에서 뿐만 아니라 수요 측인 국민들의 소비생활과 탄소국경세의 도입으로 크게 영향이 예상되는 수출산업을 포함하는 수요측면이 고려되어야 한다는 점을 상기시켰다.
따라서, 전환, 산업, 건물, 수송, 농축수산, 폐기물, 수소. 탈루 부문의 온실가스 직접배출에 대한 감축전략을 중심으로 수립된 2050 탄소중립정책은 경제활동과 연계하고, 직간접적 배출을 고려하는 산업연관분석결과를 고려하여 실용성을 보완하여 할 것으로 판단된다.
그러나, 본 연구에서 미진한 경제부문의 분류과정에서의 자료의 통합과 할당에 따른 경제활동과 온실가스 발생량을 정확히 매칭시키는 문제, 계산과정의 가정에 대한 확인 및 개선, 자료부족에 의하여 일부 산출과정에서 배제된 부문의 고려 등 향후 환경산업연관표의 정도를 높이는 후속 연구가 필요한 부문이다. 그럼에도 불구하고 한국의 경제활동과 연계하여 경제활동별 온실가스 배출특성과 이를 Scope 1, Scope 2 및 Scope 3로 나누어 결과를 검토한 첫번째 연구로서 그 의의가 매우 크다고 판단된다.
Acknowledgements
본 연구는 한국연구재단의 연구비(과제번호: NRF-2020 R1I1A2072313)과 한국산업기술진흥원의 연구비(과제번호: P0008421)지원으로 수행되었습니다. 이에 감사드립니다.
Notes
Declaration of Competing Interest
The authors declare that they have no known competing financial interests or personal relationships that could have appeared to influence the work reported in this paper.

