The Korean text of this paper can be translated into multiple languages on the website of http://jksee.or.kr through Google Translator.
토지이용형태에 따른 농업비점오염원 강우유출수 내 유량가중평균농도의 통계학적 분석 및 고찰
Abstract
Objectives
In this study, the characteristics of stormwater runoff from agricultural nonpoint pollution sources investigated under various experimental conditions were evaluated among different land use types (e.g., paddy, field, field (alpine), and vinyl house), and event mean concentrations (EMCs) for each water quality parameter were statistically analyzed. These results can be used in calculating the contribution of stormwater runoff to water quality of receiving water body by performing quantitative and qualitative analysis. The unit loads calculated were compared with Ministry of Environment TMDL (2019) to secure the reliability of the calculated unit loads.
Methods
EMCs and unit loads investigated in various studies were classified in terms of paddy, field, field (alpine), and vinyl house. Among various land use types, EMCs and unit loads were statistically analyzed quantitatively and qualitatively. For EMCs, a null hypothesis is that ‘EMCs of water quality parameters among different land use types are not different at a statistically significant level (α=0.05)’. Based on the results of statistical analysis, heteroscedasticity (p<0.05) and Welch-test method were consequently applied, and post hoc test was performed using the Games-Howell method. Finally, unit loads was compared and reviewed against the TMDL (2019) unit loads of the Ministry of Environment.
Results and Discussion
Various EMCs in all water quality parameters were found among different land use types (i.e., paddy, field, field (alpine) and vinyl house). For most water quality parameters, EMCs tended to decrease in the order of field (alpine) > field > vinyl house > paddy. The coefficient of variance (CV) values of all water q uality parameters were 0.5 or greater. Based on these results, EMCs in agricultural nonpoint source pollution are very diverse and deviated due to the combination of natural and artificial factors. Post hoc test results indicated different statistical significance among all water quality parameters. In addition to the land use types, both natural factors (i.e., season, rainfall, antecedent rainfall day, and, rainfall runoff rate) and artificial factors (i.e., cultivator manipulation, emission route, type of crop, and amount of compost) affect the characteristics of stormwater runoff. In particular, in the case of field (alpine) with prominent topographical feature of slope, and EMCs were statistically greater than those from other land use types in all water quality categories (p<0.05).
Conclusions
Countermeasures for field (alpine)with greater EMCs than paddy, field and vinyl house, should be performed priority. EMCs were affected by a complex interaction between natural factors (i.e., season, rainfall, antecedent rainfall day, and, rainfall runoff rate) and artificial factors (i.e., cultivator manipulation, emission route, type of crop, and amount of compost), and additional data and research are required for further study to elucidate these complex interactions.
Key words: event mean concentrations (EMCs), agricultural nonpoint pollutants, stormwater runoff, land use type, statistical analysis
요약
목적
본 연구에서는 다양한 실험조건 및 토지이용형태에서 조사된 농업비점오염원에서 배출되는 강우유출수를 논, 밭, 고랭지 밭, 비닐하우스로 구분한 후, 각 수질항목에 대한 유량가중평균농도(event mean concentrations, EMCs) 값을 통계학적으로 비교・분석하여 정량・정성적 특징을 규명해 강우유출수가 유입되는 하천 수질의 기여도 산정 시 보조 자료로 활용하고자 하며, 원단위(unit loads)는 환경부 오염총량기술지침(2019)원단위와 비교하여 산정된 원단위 범위의 신뢰성을 확보하고자 한다.
방법
다양한 연구에서 조사된 EMCs 및 원단위를 토지이용형태에 따라 논, 밭, 고랭지 밭, 비닐하우스로 분류하였다. 이후 토지이용형태별로 분류된 EMCs와 원단위 데이터를 통계학적으로 비교・분석하였다. EMCs 값의 경우, ‘수질인자들의 토지이용형태별 EMCs값은 통계학적으로 유의한 수준에서 다르지 않다’인 귀무가설을 수립하고 통계학적 분석 결과 이분산으로(p< 0.05)으로 조사되어 Welch-test 검정법을 활용하였으며, Games-Howell 방법을 이용하여 사후검정을 실시하였고, 원단위는 환경부 오염총량기술지침(2019)원단위와 비교・검토하였다.
결과 및 토의
논, 밭, 고랭지 밭, 비닐하우스의 토지이용형태별 모든 수질항목에서 토지이용형태에 따라 다양한 EMCs 값을 나타냈으며, 대부분의 수질항목에서 고랭지 밭 > 밭 > 비닐하우스 > 논 순으로 EMCs 값이 감소하는 경향을 나타냈다. 토지이용형태에 따른 모든 수질항목의 변동계수(CV) 값은 0.5 이상의 높은 값을 나타내는 것으로 조사되었으며, 이러한 결과를 통해 농업비점오염의 경우 여러 자연적, 인위적 요인에 따른 복합적인 작용으로 인해 EMCs 값이 매우 다양하고 편차가 큰 것으로 판단된다. 사후분석 결과, 모든 수질항목에서 각기 다른 통계학적 유의성을 나타내었다. 이는 토지이용형태 뿐만 아니라 계절, 강우량, 선행무강우일수, 강우 유출률 등의 자연적 요인과 경작주의 조작형태, 배출경로, 작물의 종류, 퇴비의 양 등의 인위적 요인이 복합적으로 결합되어 강우유출수의 유출특성에 영향을 미치며, 특히 고랭지 밭의 경우 경사도라는 독특한 지형적 특징을 가지고 있어 모든 수질 항목에서 다른 토지이용형태와 통계학적으로 유의하게 다른 것으로 도출되었다(p< 0.05)
결론
논, 밭, 비닐하우스 대비 오염도가 매우 높은 고랭지 밭에 대한 대책이 우선시되어야 한다고 판단되며, 토지 이용형태 뿐만 아니라 계절, 강우량, 선행무강우일수, 강우 유출률 등의 자연적 요인과 경작주의 조작형태, 배출경로, 작물의 종류, 퇴비의 양 등의 인위적 요인이 복합적으로 결합되어 강우유출수의 유출특성에 영향을 미치며, 이를 규명하기 위한 추가적인 데이터 확보 및 연구가 필요하다고 판단된다.
주제어: 유량가중평균농도(EMCs), 농업비점오염원, 강우유출수, 토지이용형태, 통계분석
1. 서 론
비점오염원(nonpoint source, NPS)이란 불특정 장소에서 불특정하게 수질오염물질을 배출하는 배출원을 말하며[ 1- 3], 도시 지역의 먼지와 쓰레기, 농지에 살포된 비료 및 농약, 토양 침식물, 축사유출물 및 자연동식물의 잔여물, 대기오염물질의 강하물 등을 포함한다[ 2]. 또한 점오염원과 다르게 주로 강우 시 오염원에서 오염물질이 빗물과 함께 직접적으로 하천에 유입되어 녹조대발생 및 수계오염을 야기한다[ 4]. 이러한 다양한 비점오염원 중 농업비점오염원은 농업 활동에 의해 발생되는 비료와 농약, 토사, 가축의 배설물, 미처리 축산폐수 등이 농작물에 흡수되지 않고 농경지에 남아 있다가 강우 시에 배출되는 것을 말하며[ 5], 비교적 저농도로 넓은 면적에서 대량으로 유출되는 특성을 보인다[ 6]. 특히 미국의 경우 하천 및 호소의 오염원 조사결과에 따르면, 수체로 유입되는 가장 큰 오염원은 농업관련 비점오염원으로 보고되었으며, 하천은 48%, 호소는 41%가 농업비점오염원으로 인하여 수질이 악화된 것으로 보고되었다[ 7]. 우리나라의 경우, 농업비점오염원에 대한 연구는 1980년대 후반부터 유역단위에서 실시되었고[ 8], 전체 수질오염원 중 비점오염원에서 배출되는 오염부하량의 경우 점오염원의 2배 이상 해당되는 양이며, 축산계 49.2%, 토지계 48.6% 순으로 높은 비점오염원 배출부하량 값이 나타나는 것으로 보고되었다[ 9]. 특히 하천 및 호소에 유입되는 오염물질의 약 30% 이상이 농업 활동에 의해 발생되는 것으로 보고되었다[ 10]. 따라서 강우 시 농업비점오염원에서 발생되는 배출량 및 이동경로를 정확히 파악하여 이에 대한 대책 및 저감방안을 수립해야 한다[ 11- 12]. 이러한 비점오염물질의 경우, 농도 측정 시 유출량(Q)과 농도(C)가 실시간으로 변하기 때문에 산술평균(arithmetic mean)으로 특정한 강우를 대표하는 것은 다소 무리가 따른다. 따라서 강우 시 유출되는 배출부하량 산정을 위하여 유량가중평균농도(Event mean concentrations, EMCs)를 계산하며[ 14- 18], 이를 활용하여 원단위를 산정한다[ 19~ 20]. 이와 관련해 다양한 실험 조건 및 토지이용형태 중 논에서의 EMCs와 원단위를 산정하여 강우 사상 및 강우계급에 따른 오염물질의 농도변화를 관측・분석하였으며[ 19], 밭과 고랭지 밭의 경우 EMCs, 원단위를 산정하여 유출특성을 비교・분석하고[ 20], 비닐하우스에서의 EMCs와 원단위 등을 산정하고 작물에 따른 차이를 비교하는 등[ 22- 23] 다양한 토지이용형태에 따른 농업비점오염원의 EMCs 및 원단위에 관한 연구가 지속적으로 진행되어 왔다. 이러한 연구의 결과를 통해 농업비점오염원에서 발생되는 강우유출수(stormwater runoff)의 수질에 영향을 주는 인자는 계절, 강우량, 강우 전 무강우기간, 토지이용의 형태, 강우 유출률 등 다양한 자연적 요인이 복합적으로 영향을 미치며[ 24- 26], 자연적 요인 뿐만 아니라 경작주의 물꼬관리, 조작형태, 배출경로, 양배수장 수문관리 방식, 작물의 종류, 퇴비의 양 등의 인위적 요인 역시 복합적으로 강우유출수 수질에 영향을 미치는 것으로 보고되었다[ 27- 28]. 따라서 자연적・인위적인 요인을 복합적으로 고려하여 토지이용형태에 따른 강우유출수의 수질에 영향을 미치는 요인에 대한 세분화된 조사가 필요하다. 따라서 본 연구에서는 다양한 실험조건 및 토지이용형태에서 조사된 농업비점오염원에서 배출되는 강우유출수를 토지 이용형태에 따라 논(paddy), 밭(field, upland), 고랭지 밭(field (alpine)), 비닐하우스(vinyl house)로 구분하여 정리한 후, EMCs 값을 통계학적으로 비교・분석하고, 토지이용형태에 따른 강우유출수 수질의 정량(quantitative analysis)・정성(qualitative analysis)적 특징을 분석하여, 농업비점오염원에서 배출되는 강우유출수가 유입되는 하천 수질의 기여도 산정 시 보조 자료로 활용하고자 하며, 원단위는 토지이용형태에 따라 구분하여 정리한 이후 범위를 산정하고 환경부 오염총량기술지침(2019) [ 30] 원단위와 비교하여 산정된 원단위 범위의 신뢰성을 확보하고자 한다.
2. 실험방법(또는 재료 및 방법)
2.1. 토지이용형태별 문헌조사 방법
국내의 경우, 농업비점오염원에 대한 다양한 연구가 활발히 진행되어 왔으나 조사지역의 토지이용형태, 선행무강우일수, 강우량, 강우유출률, 작물의 종류, 퇴비의 양 등 자연적, 인위적 여러 요인들의 복합적 함수에 따른 다양한 특성을 보이며[ 24- 28], 특히 토지이용형태에 따라 많은 차이를 보이고 있다[ 31- 35]. 따라서 본 연구에서는 다양한 연구에서 조사된 EMCs 및 원단위를 생활계, 축산계, 양식계 등 다른 오염원의 유입이 비교적 최소화된, 농업비점오염원의 유입이 지배적인 지역을 대상으로 토지이용형태에 따라 논, 밭, 고랭지 밭, 비닐하우스로 분류하였다. 이후 토지이용형태별로 분류된 EMCs와 원단위 데이터를 정량 및 정성적으로 통계학적 비교・분석하여 그 특징을 규명하고자 하였다.
2.2. 국내 토지이용형태별 농업비점오염원 EMCs
토지이용형태에 따른 농업비점오염원의 오염부하특성을 비교하기 위해 EMCs 및 원단위를 주로 사용한다[ 14- 20]. 농업용비점에서 발생하는 강우유출수의 농도는 강우 시 발생하는 유량에 따라 변화 폭이 매우 크다[ 20, 36]. 따라서 토지이용형태에 따른 평균 농도를 정확하게 산정하기 위해서는 강우 사상에 따른 평균 농도를 의미하며, 유량의 변화를 고려한 유량가중 평균농도를 주로 사용한다[ 14- 18]. EMCs 값은 일반적으로 Eq. (1)을 이용하여 산정되며, 다양한 선행 연구에서 조사된 토지 이용형태에 따른 EMCs 값을 Table 1에 요약・정리하였다. 이를 활용하여 토지이용형태에 따른 EMCs 값을 수질항목(BOD, COD, SS, TN, TP)에 따라 통계학적으로 비교・분석하였다. EMCs = 유량가중평균농도(mg/L)
Q(t) = 시간 t에서의 유출유량(m3/s)
C(t) = 시간 t에서의 오염농도(mg/L)
2.3. 국내 토지이용형태별 농업 비점오염원 원단위
비점오염부하량 산정 방법 중 원단위는 비점오염원이 기후, 지형, 일시 등에 따라 배출 양상이 변화하여 정확한 산정을 위해서는 장기간에 걸쳐 연속적으로 측정된 실측자료가 필요하다는 특징을 가지고 있다[ 37]. 산정기준에 따라 발생량 기준, 유출량 기준, 유달량 기준으로 구분할 수 있으며, 발생량 기준은 단위토지이용에서 단위시간에 발생한 양을 말하며, 유출량 기준은 발생해서 비점오염원이 수역으로 유출되는 양을 기준으로 하고, 유달량 기준은 배출된 오염물질이 자정작용을 거친 후 하천의 특정지점에 실제 도달하는 오염물질의 양을 말한다[ 19, 38, 39]. 본 연구에서는 강우 시 비점오염물질이 유출되는 양을 기준으로 다양한 선행연구에서 조사된 토지이용형태별 원단위 값을 수질항목(BOD, COD, SS, TN, TP)에 따라 Table 2에 요약・정리하였다. 이를 활용하여 토지이용형태에 따른 원단위를 수질항목(BOD, TN, TP)에 따라 범위를 산정하였으며, 산정된 원단위 범위는 환경부 오염총량관리기술지침(2019) [ 30]에 근거하여 고시되어 있는 토지이용형태별 발생원 단위와 비교・검토하였다.
2.4. 통계분석
농업 비점오염원의 토지이용형태에 따른 수질 차이를 평가하기 위해 수질(BOD, COD, SS TN, TP) 데이터를 각 토지이용형태별로 분류하여 기술통계(descriptive statistics)를 실시하였다. 통계프로그램인 SPSS (ver. 22.0)를 이용해 통계분석 시 모집단 간의 차이를 검정하기 위해 3개 이상의 표본에 대해 독립변수가 1개인 경우 집단 간 종속변수의 평균을 비교하는 통계적 검정방법인 일원분산분석(One-way Analysis of Variance, One-way ANOVA)을 활용하여 동일한 수질항목(종속변수)간의 토지이용형태(독립변수)별 차이(difference)가 있는지를 통계학적으로 검증하였으나, 이분산(heteroscedasticity)으로( p <0.05) 모집단들의 분산이 같지 않을 때 여러 모집단의 평균을 비교하기 위하여 사용하는 Welch-test 검정법을 활용하여 통계학적으로 검증하였다[ 40, 41]. 토지이용형태별 수질 항목간의 통계학적 차이가 유의할 경우( p < 0.05), 그룹 간의 유의성을 검증하기 위하여 Games-Howell 방법을 이용하여 사후검정(post hoc)을 실시하였다. Games-Howell 방법의 경우 Welch-test 검정법의 자유도를 이용하는 t-검정법으로, 1종 오류를 전체 비교에 대해서 통제하는 방법을 사용하며 표본의 크기가 다르더라도 설정된 유의수준을 유지하는 특징을 가지고 있으나, 각 군의 표본수가 적을수록 오류 통제에 취약한 것으로 보고되었다[ 42, 43].
3. 결과 및 고찰
3.1. 토지이용형태에 따른 EMCs 비교
토지이용형태에 따라 논, 밭, 고랭지 밭, 비닐하우스로 구분하고 각 수질항목 별 EMCs 값을 활용하여 Fig. 1에 분포의 대칭성과 중심위치, 산포의 정도 등을 도식하여 Box 그래프로 나타내었다. 이에 해당하는 샘플 수(N), 산술평균(µ), 표준편차(σ), 변동계수(coefficient of variation, CV), 최대값(Max.), 최소값(Min.)을 Table 3에 제시하였다. 논, 밭, 고랭지 밭, 비닐하우스의 토지이용형태별 모든 수질항목에서 토지이용형태에 따라 다양한 EMCs 값을 나타내었으며, 대부분의 수질항목에서 고랭지 밭 > 밭 > 비닐하우스 > 논 순으로 토지이용형태에 따른 EMCs 값이 감소하는 경향을 나타내었다. 특히 논, 밭, 비닐하우스 대비 오염도가 매우 높은 고랭지 밭의 경우 저감방안 및 대책이 우선시되어야 한다고 판단된다. 변동계수(CV)를 비교한 결과, 모든 토지이용형태에서 BOD, COD, SS, TN, TP의 CV 값은 0.5 이상 높은 값을 나타내는 것으로 조사되었으며, 이러한 결과를 통해 농업비점오염의 경우 여러 자연적, 인위적 요인에 따른 복합적인 작용으로 인해 EMCs 값이 매우 다양하고 편차가 큰 것으로 판단된다. 특히 SS의 경우논, 밭, 고랭지 밭, 비닐하우스에서 각각 1.71, 1.30, 1.19, 1.19로 매우 높은 CV 값을 나타내었으며, 이는 Shin 외[ 70], Kim 외[ 25], Jung 외[ 59]의 연구에서 조사된 바와 동일하게 SS의 경우, 강우사상에 따른 영향을 크게 받아 다른 수질항목 대비 모든 토지이용형태에서 CV 값이 1 이상으로 분석되었다. 또한 토지이용형태에 따라 조사된 EMCs 값의 연구기간, 연구방법의 차이와 측정횟수 등의 제한으로 인하여 토지이용형태에 따른 정밀한 통계분석이 실시되지 않아 향후 다양한 강우사상별, 인위적 요인을 고려한 추가적인 연구 및 데이터 확보를 통하여 정확한 통계분석이 이루어져야 한다고 판단된다.
3.2. 일원분산분석(ANOVA) 결과 및 사후분석
‘수질인자들의 토지이용형태별 EMCs 값은 통계학적으로 유의한 수준에서 다르지 않다’인 귀무가설(H0 : µEMC, Paddy = µEMC, Field = µEMC, Field (Alpine) = µEMC, Vinyl house)을 수립하고 5항목(BOD, COD, SS, TN, TP)에 관하여 일원분산분석(One-way ANOVA) 실시한 결과, 모든 수질항목에서 이분산으로 나타나 Welch-test 검정법을 진행하였으며, p < 0.05로 토지이용형태 간의 유의한 차이가 있는 것으로 분석되어 Games-Howell 검정법을 이용하여 사후검정(post hoc)을 실시하였다.
3.2.1. BOD 유량가중평균농도(EMCBOD)비교
BOD의 토지이용형태별 EMCs값의 분포를 Fig. 2에 비교하여 제시하였다. EMC BOD의 경우 고랭지 밭 > 비닐하우스 > 밭 > 논 순으로 높은 EMC BOD 값을 보이는 것으로 조사되었으며, Welch-test 검정법을 통해, EMC BOD 값의 차이는 통계학적으로 유의한 것으로 도출되었다( p < 0.05). 토지이용형태 간의 유의성을 검증하기 위하여 Games-Howell 검정법을 이용해 사후검정을 실시한 결과를 Table 4에 제시하였다. 고랭지 밭과 논, 밭, 비닐하우스의 EMC BOD값 차이는 통계학적으로 유의한 것으로 도출되었으며( p<0.05), 밭과 논, 비닐하우스의 EMC BOD값 차이는 통계학적으로 유의하지 않은 것으로 도출되었다( p≥0.05). 그러나 논과 비닐하우스의 EMC BOD 값 차이는 통계학적으로 유의한 것으로 도출되었다( p<0.05). 이와 같은 EMC BOD 값의 차이는 BOD의 경우 강우 시 토양 내부 또는 표면유출에 의하여 유출이 진행되는 특징을 가지고 있어 경작 시 대부분의 기간 동안 물을 관개하는 논의 EMC BOD 값은 비교적 낮으며, 고랭지 밭의 경우 논, 밭, 비닐하우스와 달리 경사도라는 독특한 지형적 특징을 가지고 있어 EMC BOD 값이 높은 반면, 밭과 비닐하우스의 경우 문헌에 따라 다양한 작물이 재배됨에 따라 매우 넓은 범위의 EMC BOD 값을 나타내어 이와 같은 통계학적 결과를 나타나는 것으로 판단된다. 이는 Jeon 외[ 23]의 연구에서도 재배작물에 따라 다양한 EMC 값을 가진다는 동일한 연구결과가 제시되었다. 하지만 밭과 비닐하우스의 경우 많은 이상치(outlier)들이 포함되어 각 토지이용 형태별 EMC BOD 값을 대표하기에는 부족한 것으로 판단되며, 향후 토지이용형태에 따른 다양한 실험조건에서 EMC BOD data를 확보하여 통계학적 비교・분석이 수행되어야 한다고 판단된다.
3.2.2. COD 유량가중평균농도(EMCCOD)비교
COD의 토지이용형태별 EMCs값의 분포를 Fig. 3에 비교하여 제시하였다. COD의 경우 고랭지 밭 > 밭 > 비닐하우스 > 논 순으로 높은 EMC COD 값을 보이는 것으로 조사되었으며 Welch-test 검정법을 통해, EMC COD 값의 차이는 통계학적으로 유의한 것으로 도출되었다( p<0.05). 토지이용형태간의 유의성을 검증하기 위하여 Games-Howell 검정법을 이용하여 사후검정을 실시한 결과를 Table 5에 제시하였다. 고랭지 밭과 논, 밭, 비닐하우스의 EMC COD 값 차이는 통계학적으로 유의한 것으로 도출되었으며( p<0.05), 고랭지 밭을 제외한 논과 밭, 비닐하우스의 경우 EMC COD값 차이는 통계학적으로 유의하지 않은 것으로 도출되었다( p≥ 0.05). EMC COD의 경우 EMC BOD의 통계학적 결과와 유사한 결과를 나타내었으나, 일반적으로 COD의 경우 BOD보다 높은 값을 나타내며, 표준편차 역시 비교적 크게 나타나 data가 넓게 분포하여 EMC BOD와 달리 논, 밭, 비닐하우스의 EMC COD 값 차이는 통계학적으로 유의하지 않은 것으로 도출된 것으로 판단된다.
3.2.3 SS 유량가중평균농도(EMCSS)비교
SS의 토지이용형태별 EMCs값의 분포를 Fig. 4에 비교하여 제시하였다. SS의 경우 고랭지 밭 > 밭 > 비닐하우스 > 논 순으로 높은 EMC SS 값을 보이는 것으로 조사되었으며 Welch-test 검정법을 통해, EMC SS 값의 차이는 통계학적으로 유의한 것으로 도출되었다( p<0.05). 토지이용형태간의 유의성을 검증하기 위하여 Games-Howell 검정법을 이용하여 사후검정을 실시한 결과를 Table 6에 제시하였다. 모든 토지이용형태에서 EMC SS 값의 차이는 통계학적으로 유의한 것으로 도출되었다( p<0.05). EMC SS 값의 경우 강우 시 발생하는 강우유출수에 많은 토양 입자가 포함되며, 높은 경사도를 나타내는 고랭지 밭에서 변동 폭이 매우 넓고 가장 큰 EMC SS 값을 나타내며, 논의 EMC SS 값의 경우 비교적 경사도가 낮고, 물을 대어 경작을 진행하며 밭, 고랭지 밭, 비닐하우스의 경우에는 물을 대지 아니하거나 필요한 때에만 물을 대어 경작을 하는 경작 차이에 의하여 가장 낮은 EMC SS 값이 나타난 것으로 판단된다. 비닐하우스의 경우 밭과 비교 시, 면적 중 상당부분 구조물로 인한 불투수층으로 구성되어 있어 밭 대비 토사의 유출이 비교적 적게 일어나 낮은 EMC SS 값을 나타내는 것으로 판단된다.
3.2.4. TN 유량가중평균농도(EMCTN)비교
TN의 토지이용형태별 EMCs값의 분포를 Fig. 5에 비교하여 제시하였다. TN의 경우 고랭지 밭 > 밭 > 논 > 비닐하우스 순으로 높은 EMC TN 값을 보이는 것으로 조사되었으며 Welch-test 검정법을 통해, EMC TN 값의 차이는 통계학적으로 유의한 것으로 도출되었다( p<0.05). 토지이용형태간의 유의성을 검증하기 위하여 Games-Howell 검정법을 이용하여 사후검정을 실시한 결과를 Table 7에 제시하였다. 고랭지 밭과 논, 밭, 비닐하우스의 EMC TN 값 차이는 통계학적으로 유의한 것으로 도출되었으며( p<0.05), 논과 비닐하우스의 EMC 값 차이는 통계학적으로 유의하지 않은 것으로 도출되었다( p≥ 0.05). 이는 비닐하우스의 EMC TN 값이 논보다 낮은 값을 나타내나 논의 경우 기비, 추기 등 경작 시기에 따라 퇴비 및 비료를 주기적으로 시비하고, 시비량 또한 경작주 마다 차이를 보이며, 경작주의 물꼬 조절 정도에 따라 배출 부하량이 달라, 측정 시기에 따라서 수질에 크게 영향을 미치는 것으로 보고되었으며[ 71, 72], 이러한 영향으로 넓은 EMC TN 값이 도출되어 통계학적으로 유의하지 않는 것으로 판단된다. 그러나 밭의 경우 논, 비닐하우스의 EMC값 차이는 통계학적으로 유의한 것으로 도출되었다( p<0.05). 이는 다른 수질항목의 통계학적 결과와 동일하게 고랭지 밭이 다른 토지이용형태와 달리 경사도라는 독특한 지형적 특징을 가지고 있어 다른 토지이용형태 대비 높은 EMC TN 값을 나타내는 것으로 판단된다. 또한 EMC TN 값의 경우 재배 작물에 따른 영양염류 시비 및 퇴비 살포 등 소유주의 농업 방식 차이가 중요한 요인으로 작용하며[ 23], 이로 인해 밭의 EMC TN 값은 논, 비닐하우스 대비 문헌에 따라 매우 넓은 EMC TN 값을 나타내어 논, 비닐하우스와 통계학적으로 유의한 것으로 판단되어지나, 문헌에 따른 EMC TN 값의 편차가 크고, 비닐하우스의 경우 논, 밭 대비 조사지역의 수가 적은 등 모집단 대표성의 한계로 인하여 정확한 통계분석이 실시되지 않아, 향후 데이터 확보를 위해 다양한 요인을 고려한 지속적이고 광범위한 추가적인 연구가 필요한 것으로 판단된다.
3.2.5. TP 유량가중평균농도(EMCTP)비교
TP의 토지이용형태별 EMCs값의 분포를 Fig. 6에 비교하여 제시하였다. TP의 경우 고랭지 밭 > 비닐하우스 > 밭 > 논 순으로 높은 EMC TP 값을 보이는 것으로 조사되었으며, Welch-test 검정법을 통해, EMC TP 값의 차이는 통계학적으로 유의한 것으로 도출되었다( p<0.05). 토지이용형태간의 유의성을 검증하기 위하여 Games-Howell 검정법을 이용하여 사후검정을 실시한 결과를 Table 8에 제시하였다. 고랭지 밭과 논, 밭, 비닐하우스의 EMC TP 값 차이는 통계학적으로 유의한 것으로 도출되었으며( p<0.05), 논과 밭, 비닐하우스, 고랭지 밭의 EMC TP 값 차이는 통계학적으로 유의한 것으로 도출되었다( p<0.05). TP의 경우 토양 중에서 철, 알루미늄과 같은 금속산화물과 결합하여 난용성 염을 만들어 고정되는 특징을 가지고 있기 때문에 토양의 유출과 연관성이 높아[ 21, 23, 73], EMC SS값과 유사한 결과가 도출되며, 논의 경우 물을 대어 경작을 진행하기 때문에 밭, 고랭지 밭, 비닐하우스 대비 토양 유출이 비교적 적어 낮은 EMC TP 값을 나타내었다. 고랭지 밭의 EMC TP 값 역시 다른 수질항목과 동일하게 경사도라는 독특한 지형적 특징으로 인하여 비교적 매우 높은 값을 나타내어 이러한 통계학적 결과를 나타내는 것으로 판단된다. 그러나 밭과 비닐하우스 EMC TP 값 차이는 통계학적으로 유의하지 않은 것으로 도출되었다( p≥ 0.05). 이는 비닐하우스의 경우 밭 대비 넓은 불투수면적과 영양염류 시비 및 퇴비의 살포로 인하여 높은 EMC TP 값이 도출되어 이러한 통계학적 결과를 나타낸 것으로 판단되나 조사지역의 수가 적어 정확한 통계분석이 이루어지지 못해 영양염류 항목인 EMC TN 값과 동일하게 다양한 요인들을 고려한 지속적이고 광범위한 추가적인 연구를 통하여 데이터 확보가 필요한 것으로 판단된다.
3.3. 토지이용형태 별 원단위 비교
다양한 선행연구에서 조사된 토지이용형태에 따른 수질항목(BOD, TN, TP) 원단위 값을 활용하여 토지이용형태에 따른 원단위 범위와 오염총량관리기술지침(2019) [ 30]에서 제시하고 있는 비점오염원 원단위를 비교하여 Fig. 7에 나타내었다. 국내 오염총량관리기술지침에서 제시된 수질항목 모두 본 연구에서 제시된 원단위 범위에 포함되었다. 그러나 제시된 원단위 범위의 경우 조사지역의 토지이용형태, 선행무강우일수, 강우량, 퇴비의 양 등 자연적, 인위적 요인의 차이에 의하여 비교적 넓은 범위가 나타났으며, 연구기간, 연구방법, 측정횟수 등의 차이에 따라 다양한 원단위 값이 도출된 것으로 판단된다. 이는 Won 외[ 21], Jeon 외[ 22]의 연구에서도 동일한 연구결과가 제시되었으며, 장기적이고 통일된 공식이 필요할 것으로 판단된다. 또한 논, 밭과 비교하여 고랭지 밭과 비닐하우스의 경우 표본 수가 비교적 적고, 오염총량관리기술지침에서 값이 제시되지 않아 정확한 비교가 어려워, 향후 추가적인 연구를 통해 더 많은 데이터가 확보되어야 토지 이용형태에 따른 원단위의 특성을 정확히 파악하고, 신뢰성을 확보할 수 있을 것으로 판단된다.
4. 결 론
본 연구에서는 다양한 문헌에서 조사된 농업용 비점에서 배출되는 강우유출수의 유량가중평균농도 및 원단위를 이용하여 토지이용형태에 따라 구분하고 통계학적으로 비교・분석하였으며 다음과 같은 결론을 도출하였다.
1) 토지이용형태에 따른 통계학적 비교・분석 결과, 조사지역의 토지이용형태, 선행무강우일수, 강우량, 강우 유출률, 경작주의 물꼬관리, 조작형태, 배출경로, 양배수장 수문관리 방식, 작물의 종류, 퇴비의 양 등 여러 자연적, 인위적 요인들에 의하여 문헌별 데이터가 다양하게 분포하며, 수질항목에 따라 토지이용형태에 따른 EMCs 값의 차이가 발생한다. 특히 SS의 경우 강우사상에 따른 영향을 크게 받아 논, 밭, 고랭지 밭, 비닐하우스에서 각각 1.71, 1.30, 1.19, 1.19로 매우 높은 CV 값을 나타내었다.
2) 모든 수질항목(BOD, COD, SS, TN, TP)에서 토지이용형태별 EMCs 값의 차이는 통계학적으로 유의한 것으로 도출되었다(p<0.05). Games-Howell 검정법을 이용하여 사후검정을 실시한 결과, 수질항목에 따라 각기 다른 통계학적 결과를 나타내었다. 이는 고랭지 밭의 경사도 라는 독특한 지형적 특징, 밭과 비닐하우스의 재배작물의 종류에 따른 차이, 논의 경우 물을 대어 경작하고 밭, 고랭지 밭, 비닐하우스의 경우 필요한 때에만 물을 대어 경작하는 경작 차이, 비닐하우스의 구조물에 의한 차이, 경작주의 경작시기에 따른 시비량, 물꼬 조절의 차이 등 다양한 자연적, 인위적 요인에 의하여 이러한 통계학적 결과가 나타난 것으로 판단된다.
3) 논, 밭, 비닐하우스 대비 오염도가 매우 높은 고랭지 밭에 대한 대책이 우선시되어야 한다고 판단되지만, 토지이용형태 뿐만 아니라 계절, 강우량, 선행무강우일수, 강우 유출률 등의 자연적 요인과 경작주의 물꼬관리, 조작형태, 배출경로, 양배수장 수문관리 방식, 작물의 종류, 퇴비의 양 등의 인위적 요인이 복합적으로 강우유출수의 유출특성에 영향을 미치며, 이를 규명하기 위한 다양한 요인을 고려한 지속적이고 광범위한 추가적인 연구가 필요한 것으로 판단된다.
4) 원단위의 경우 논과 밭은 오염총량관리기술지침에서 제시하고 있는 비점오염원 원단위와 비교 시 본 연구에서 제시하고 있는 범위 안에 포함되는 것을 확인 할 수 있었으나 논, 밭과 비교하여 고랭지 밭과 비닐하우스는 표본 수가 적고 오염총량관리기술지침에서 제시되지 않아 더 많은 데이터가 확보되어야 토지 이용형태에 따른 원단위의 특성을 정확히 파악하고, 신뢰성을 확보할 수 있을 것으로 판단된다.
Notes
Declaration of Competing Interest
The authors declare that they have no known competing financial interests or personal relationships that could have appeared to influence the work reported in this paper.
Fig. 1.
Box plot of event mean concentrations (EMCs) of various pollutants among land use types 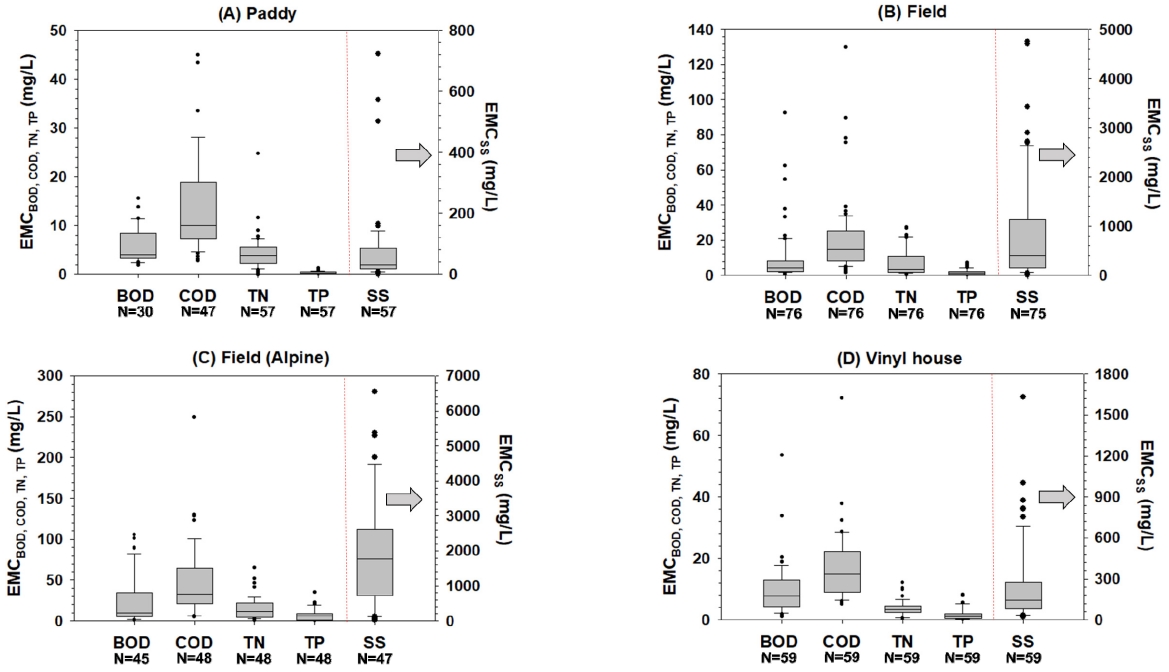
Fig. 2.
Box plot of event mean concentrations (EMCs) of biochemical oxygen demand (BOD) among land use types (a > b > c). 
Fig. 3.
Box plot of event mean concentrations (EMCs) of chemical oxygen demand (COD) among land use types (a > b). 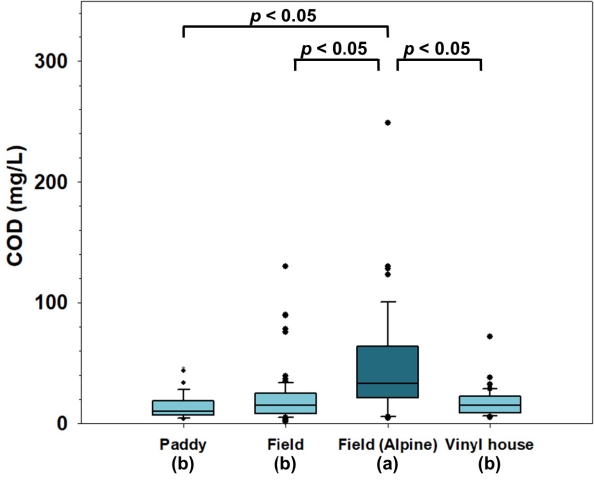
Fig. 4.
Box plot of event mean concentrations (EMCs) of suspended solids (SS) among land use types (a > b > c > d). 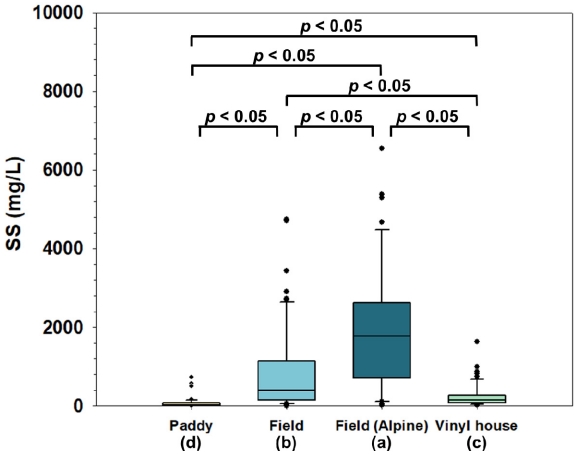
Fig. 5.
Box plot of event mean concentrations (EMCs) of total nitrogen (TN) among land use types (a > b > c). 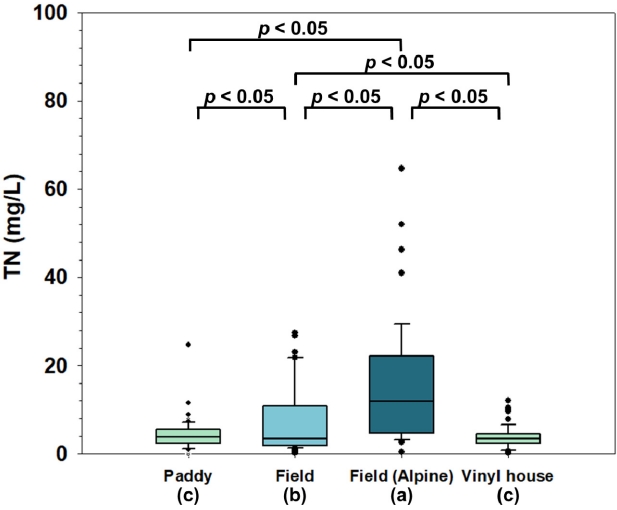
Fig. 6.
Box plot of event mean concentrations (EMCs) of total phosphorus (TP) among land use types (a > b > c). 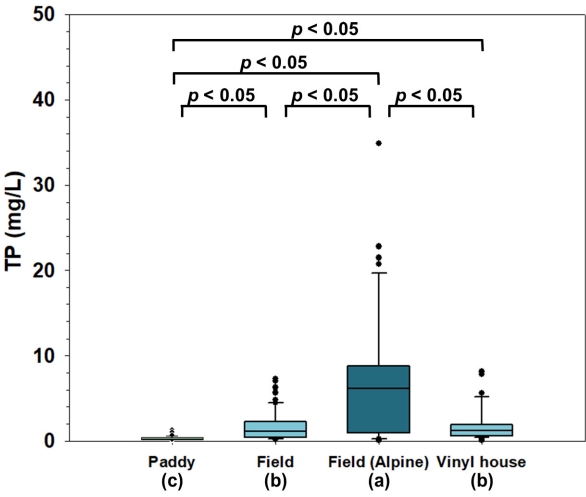
Fig. 7.
Comparison of non-point source pollution unit loads of various pollutants among land use types 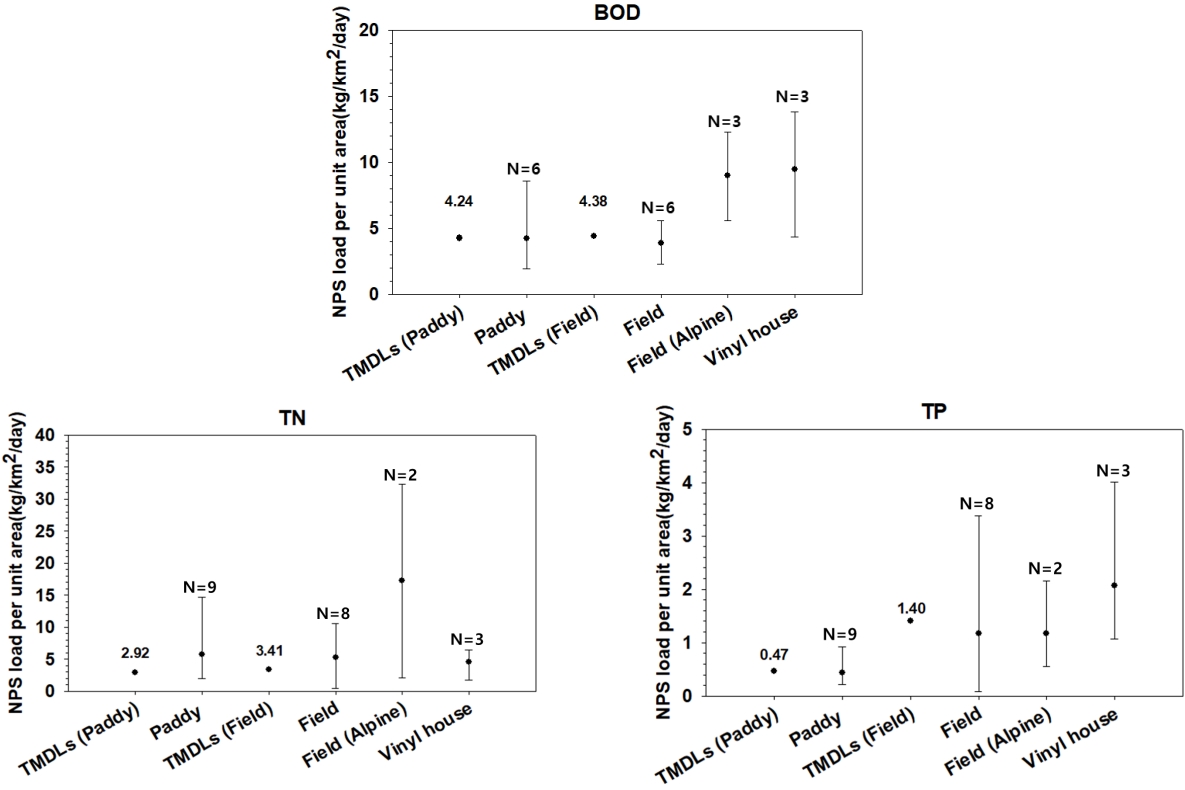
Table 1.
Comparison of event mean concentrations (EMCs) of various pollutants among land use types (units : mg/L).
|
Land use |
Crop |
BOD |
COD |
SS |
TN |
TP |
Reference |
|
Paddy |
Rice |
2.40~4.50 (3.30) |
4.20~13.90 (9.80) |
7.8~51.30 (22.28) |
0.889~3.072 (1.791) |
0.214~0.583 (0.359) |
Kwon et al. (2017) [19] |
|
Paddy |
Rice |
N.A. |
4.79~17.25 (10.66) |
3.24~722.84 (82.94) |
0.010~8.880 (2.420) |
0.060~1.290 (0.470) |
Jung et al. (2014) [44] |
|
Paddy |
Rice |
(3.68) |
(9.87) |
(55.28) |
(2.640) |
(0.370) |
Choi et al. (2014) [45] |
|
Paddy |
Rice |
N.A. |
2.72~44.87 (10.10) |
1.21~138.05 (19.46) |
0.380~24.730 (3.930) |
0.040~0.660 (0.230) |
Jung et al. (2007) [46] |
|
Paddy |
Rice |
N.A. |
16.20~43.30 |
103.00~573.00 |
0.700~6.720 |
0.070~0.570 |
Kim et al. (2012) [47] |
|
Paddy |
Rice |
1.9~9.70 (4.24) |
3.60~18.90 (8.3) |
17.10~55.30 (31.88) |
1.638~7.166 (3.794) |
0.156~1.037 (0.435) |
Park et al. (2015) [48] |
|
Paddy |
Rice |
N.A. |
4.90~26.80 (1.00) |
5.80~22.10 (15.10) |
0.400~5.200 (1.900) |
0.120~0.570 (0.210) |
Yoon (2008) [49] |
|
Paddy |
Rice |
N.A. |
3.00~44.90 (10.90) |
10.50~22.30 (16.60) |
1.300~7.000 (3.200) |
0.130~0.660 (0.310) |
|
Paddy |
Rice |
N.A. |
6.50~25.30 (12.10) |
1.20~48.20 (17.10) |
4.100~7.700 (5.300) |
0.090~0.330 (0.200) |
|
Paddy |
Rice |
8.21~13.77 (10.63) |
15.56~26.87 (22.47) |
13.82~20.84 (17.46) |
3.200~4.810 (4.153) |
0.210~0.240 (0.227) |
Park et al. (2005) [32] |
|
Paddy |
Rice |
8.48~15.50 (11.41) |
16.31~33.42 (25.52) |
12.60~35.65 (24.97) |
5.080~7.230 (6.2470) |
0.220~0.420 (0.320) |
|
Paddy |
Rice |
N.A. |
N.A. |
82.27~502.12 (158.42) |
3.645~11.580 (6.024) |
0.106~0.201 (0.140) |
Yoon et al. (2002) [50] |
|
Field |
Bean |
5.00~12.00 |
12.50~33.50 |
6.60~2600.00 |
0.300~3.810 |
1.540~3.610 |
Won et al. (2011) [21] |
|
Field |
N.A. |
6.40~22.70 |
8.80~28.90 |
N.A. |
1.500~1.700 |
0.400~0.980 |
Won et al. (2009) [20] |
|
Field |
Grape |
1.50~7.00 (3.70) |
3.40~22.10 (10.00) |
44.80~696.70 (182.70) |
0.435~2.283 (1.369) |
0.155~0.665 (0.320) |
Yoon et al. (2011) [51] |
|
Field |
Kyoho Grape |
1.60~6.40 (3.30) |
5.20~22.10 (13.00) |
36.30~727.30 (240.70) |
0.911~3.890 (2.178) |
0.183~0.725 (0.328) |
|
Field |
Sweet potato |
1.60~7.40 (3.90) |
2.80~39.00 (19.23) |
127.70~4751.30 (2068.53) |
1.760~23.100 (8.590) |
0.550~2.660 (1.230) |
Jo (2009) [52] |
|
Field |
Balloon flower |
12.01~92.56 (62.39) |
14.98~130.12 (89.64) |
202.30~1928.30 (1231.20) |
0.940~5.640 (2.290) |
1.540~7.310 (5.610) |
Choi et al. (2009) [53] |
|
Field |
Balloon flower |
4.5~10 (7.34) |
5.1~23.8 (12.34) |
107.8~357.9 (202.26) |
2.435~21.755 (7.722) |
1.366~4.819 (2.532) |
Shin et al. (2012) [54] |
|
Field |
Potato |
0.6~10.1 (4.08) |
4.3~29.2 (10.42) |
126.6~2485.6 (738.21) |
3.404~27.473 (15.261) |
0.193~3.174 (1.296) |
|
|
Field |
Sweet potato |
1~68 (16.14) |
3.7~504 (99.28) |
84.303~51756 (7724.64) |
2.18~359 (51.629) |
0.3~26.1 (4.919) |
Kang et al. (2009) [55] |
|
Field |
Cherry tree |
0.615~7.69 (3.669) |
14.5~36.7 (24.6) |
75.3~3430 (1270.8) |
4.17~26.7 (10.269) |
1.135~1.667 (1.354) |
Kang et al. (2010) [56] |
|
Field |
Perilla, Radish |
(20.1) |
(25.2) |
(429.6) |
(15.1) |
(4) |
Lee et al. (2015) [57] |
|
(12) |
(25.1) |
(75) |
(14.8) |
(3.8) |
|
(33.1) |
(26.4) |
(1570.9) |
(15.3) |
(4.4) |
|
(12.6) |
(23.9) |
(333.8) |
(16.2) |
(4.5) |
|
Field (Alpine) |
Bean |
4.00~15.00 |
6.00~41.00 |
32.90~17182.10 (4422.60) |
0.360~9.440 |
0.270~3.720 |
Won et al. (2011) [21] |
|
Field (Alpine) |
Potato |
17.42~60.37 (39.70) |
25.64~130.13 (53.10) |
803.70~5377.10 (2252.70) |
8.340~27.030 (10.410) |
6.280~10.660 (7.820) |
Choi et al. (2009) [58] |
|
Field (Alpine) |
N.A. |
0.90~3.3 (1.82) |
4.76~8.87 (6.57) |
40.20~713.60 (205.2) |
2.950~6.360 (3.940) |
0.087~0.655 (0.266) |
Jung et al. (2009) [59] |
|
Field (Alpine) |
N.A. |
N.A. |
27.10~38.60 (33.10) |
1099.00~6547.00 (3438) |
5.600~13.100 (10.800) |
0.460~1.340 (0.800) |
Lee et al. (2015) [60] |
|
Field (Alpine) |
N.A. |
4.30~29.40 (10.40) |
15.70~96.00 (42.40) |
116.00~4670.70 (1955.10) |
13.360~64.679 (27.705) |
2.855~11.197 (7.031) |
Lee et al. (2017) [61] |
|
Field (Alpine) |
Daikon |
29.63~105.78 (89.54) |
36.05~249.16 (128.37) |
1050.49~3186.96 (2229.59) |
2.5~15.45 (10.77) |
3.61~34.87 (20.77) |
Choi et al. (2012) [62] |
|
Vinyl house |
Oriental melon |
1.50~53.50 (10.50) |
6.70~72.10 (19.60) |
27.20~874.20 (227.50) |
1.900~10.000 (4.500) |
0.100~7.800 (2.400) |
Jeon et al. (2014) [22] |
|
Vinyl house |
Tomato |
1.20~33.90 (9.60) |
5.80~37.80 (17.30) |
30.10~1629.90 (319.50) |
0.300~12.100 (4.500) |
0.400~8.200 (2.600) |
Jeon et al. (2013) [23] |
|
Vinyl house |
N.A. |
(8.30) |
(13.06) |
N.A. |
(3.910) |
(6.640) |
Yoon et al. (2008) [63,64] |
|
Vinyl house |
N.A. |
4.20~53.50 (13.21) |
8.60~72.10 (21.10) |
24.20~1629.90 (344.04) |
1.900~10.350 (5.071) |
0.100~7.900 (2.247) |
Choi et al. (2010) [65] |
|
Vinyl house |
Oriental melon |
4.2~53.5 (13.13) |
8.6~72.1 (21.54) |
43.3~874.2 (248.51) |
1.9~10.047 (4.151) |
0.07~7.848 (1.931) |
Kim (2012) [66] |
|
Vinyl house |
Tomato |
4.2~33.9 (12.83) |
8.7~37.8 (20.99) |
30.1~1629.9 (386.96) |
2.1~10.368 (4.518) |
0.385~5.551 (1.609) |
|
Vinyl house |
Cabbage |
6.674~15.39 (11.54) |
9.397~24.50 (18.59) |
29.73~228.30 (112.41) |
2.082~3.768 (3.093) |
0.551~0.748 (0.652) |
|
Vinyl house |
Straberry |
1.30~5.00 (3.222) |
5.20~8.00 (6.522) |
24.50~114.60 (70.2) |
0.417~4.289 (1.598) |
0.282~2.563 (0.703) |
Table 2.
Comparison of non-point source pollution unit loads of various pollutants among land use types (units : kg/km2/day)
|
Land use |
Crop |
BOD |
COD |
SS |
TN |
TP |
Reference |
|
Paddy |
Rice |
4.24 |
N.A. |
N.A. |
2.92 |
0.47 |
TMDLs (2019) [30] |
|
Paddy |
Rice |
2.00 |
8.05 |
7.59 |
1.96 |
0.30 |
Kwon et al. (2017) [19] |
|
Paddy |
Rice |
N.A. |
14.28 |
34.98 |
4.35 |
0.29 |
|
|
Paddy |
Rice |
N.A. |
8.23 |
24.58 |
3.16 |
0.35 |
Yoon (2008) [49] |
|
Paddy |
Rice |
N.A. |
12.63 |
65.76 |
6.63 |
0.28 |
|
|
Paddy |
Rice |
1.93 |
N.A. |
80.00 |
6.20 |
0.92 |
Ahn at al. (2012) [33] |
|
Paddy |
Rice |
8.58 |
17.64 |
34.65 |
4.48 |
0.21 |
Park et al. (2005) [32] |
|
Paddy |
Rice |
5.57 |
N.A. |
N.A. |
14.70 |
0.25 |
Joo et al. (2007) [67] |
|
Paddy |
Rice |
2.90 |
7.67 |
17.81 |
6.90 |
0.88 |
Moon et al. (1999) [68] |
|
Field |
N.A. |
4.38 |
N.A. |
N.A. |
3.41 |
1.40 |
TMDLs (2019) [30] |
|
Field |
Bean |
2.99 |
7.84 |
392.47 |
0.41 |
0.71 |
Won et al. (2011) [21] |
|
Field |
N.A. |
5.55 |
N.A. |
893.00 |
7.45 |
3.38 |
Ahn at al. (2012) [33] |
|
Field |
N.A. |
5.40 |
8.09 |
145.18 |
2.41 |
0.08 |
Park et al. (2005) [32] |
|
Field |
Sweet potato |
2.3 |
12.6 |
1167.3 |
7.7 |
0.7 |
Jo (2009) [52] |
|
Field |
N.A. |
2.68 |
7.56 |
53.42 |
10.60 |
0.82 |
Moon et al.(1999) [68] |
|
Field |
Bean, Corn, Tobacco |
N.A. |
18.08~24.66 |
1178.08 |
3.83~6.30 |
1.10 |
Choi et al. (2004) [69] |
|
Field (Alpine) |
Bean |
5.56 |
12.63 |
2,643.86 |
2.08 |
0.82 |
Won et al. (2011) [21] |
|
Field (Alpine) |
N.A. |
9.16 |
N.A. |
32.64 |
N.A. |
2.15 |
Jung et al. (2009) [59] |
|
Field (Alpine) |
N.A. |
12.25 |
N.A. |
N.A. |
32.35 |
0.55 |
Joo et al. (2007) [67] |
|
Vinly house |
N.A. |
4.33 |
8.42 |
126.05 |
1.68 |
1.07 |
Choi et al. (2010) [65] |
|
Vinly house |
N.A. |
10.26 |
N.A. |
54.80 |
5.59 |
1.11 |
Ahn at al.(2012) [33] |
|
Vinly house |
N.A. |
13.80 |
28.40 |
396.60 |
6.40 |
4.01 |
Kim (2012) [66] |
Table 3.
Statistical analysis of event mean concentrations (EMCs) of various pollutants among land use types
|
Land use |
Sample Number (N) |
Mean (μ) |
Standard deviation (σ) |
Coefficient of variation (CV) |
Min. |
Max. |
|
BOD (mg/L) |
Paddy |
30 |
5.72 |
3.67 |
0.64 |
1.90 |
15.50 |
|
Field |
76 |
9.15 |
14.54 |
1.59 |
0.60 |
92.56 |
|
Field (Alpine) |
45 |
25.12 |
30.27 |
1.21 |
0.90 |
105.78 |
|
Vinyl house |
59 |
9.83 |
8.41 |
0.86 |
1.20 |
53.50 |
|
COD (mg/L) |
Paddy |
47 |
14.63 |
10.81 |
0.74 |
2.72 |
44.90 |
|
Field |
76 |
20.42 |
20.31 |
0.99 |
1.50 |
130.12 |
|
Field (Alpine) |
48 |
47.36 |
44.82 |
0.95 |
4.76 |
249.16 |
|
Vinyl house |
59 |
16.98 |
10.78 |
0.63 |
5.20 |
72.10 |
|
SS (mg/L) |
Paddy |
57 |
77.62 |
132.98 |
1.71 |
1.20 |
722.84 |
|
Field |
75 |
870.27 |
1131.78 |
1.30 |
6.60 |
4751.30 |
|
Field (Alpine) |
47 |
1900.16 |
1591.00 |
1.19 |
32.90 |
6547.00 |
|
Vinyl house |
59 |
243.46 |
290.65 |
1.19 |
24.50 |
1629.90 |
|
TN (mg/L) |
Paddy |
57 |
4.39 |
3.59 |
0.82 |
0.01 |
24.73 |
|
Field |
76 |
7.25 |
7.47 |
1.03 |
0.30 |
27.47 |
|
Field (Alpine) |
48 |
15.55 |
13.48 |
0.87 |
0.36 |
64.68 |
|
Vinyl house |
59 |
3.83 |
2.47 |
0.65 |
0.30 |
12.10 |
|
TP (mg/L) |
Paddy |
57 |
0.32 |
0.23 |
0.71 |
0.04 |
1.29 |
|
Field |
76 |
1.69 |
1.73 |
1.02 |
0.16 |
7.31 |
|
Field (Alpine) |
48 |
6.95 |
7.16 |
1.03 |
0.09 |
34.87 |
|
Vinyl house |
59 |
1.95 |
2.03 |
1.04 |
0.07 |
8.20 |
Table 4.
Multiple comparisons of event mean concentrations (EMCs) of biochemical oxygen demand (BOD) among land use types.
|
Type |
Mean difference (I-J) |
Std. Error |
p-value |
|
|
|
Games-Howell |
Paddy |
Field |
-3.430 |
1.797 |
0.231 |
-8.130 |
1.269 |
|
Field (Alpine) |
-19.399*
|
4.562 |
0.001 |
-31.559 |
-7.238 |
|
Vinyl house |
-4.106*
|
1.283 |
0.010 |
-7.468 |
-0.745 |
|
Field |
Paddy |
3.430 |
1.797 |
0.231 |
-1.269 |
8.130 |
|
Field (Alpine) |
-15.969*
|
4.811 |
0.008 |
-28.706 |
-3.231 |
|
Vinyl house |
-0.676 |
1.995 |
0.987 |
-5.871 |
4.518 |
|
Field (Alpine) |
Paddy |
19.399*
|
4.562 |
0.001 |
7.238 |
31.559 |
|
Field |
15.969*
|
4.811 |
0.008 |
3.231 |
28.706 |
|
Vinyl house |
15.292*
|
4.643 |
0.010 |
2.945 |
27.639 |
|
Vinyl house |
Paddy |
4.106*
|
1.283 |
0.010 |
0.745 |
7.468 |
|
Field |
0.676 |
1.995 |
0.987 |
-4.518 |
5.871 |
|
Field (Alpine) |
-15.292*
|
4.643 |
0.010 |
-27.639 |
-2.945 |
Table 5.
Multiple comparisons of event mean concentrations (EMCs) of chemical oxygen demand (COD) among land use types.
|
Type |
Mean difference (I-J) |
Std. Error |
p-value |
Confidence interval
|
|
95% Lower |
95% Upper |
|
Games-Howell |
Paddy |
Field |
-5.788 |
2.813 |
0.173 |
-13.117 |
1.541 |
|
Field (Alpine) |
-2.346 |
2.110 |
0.683 |
-7.860 |
3.169 |
|
Vinyl house |
5.788 |
2.813 |
0.173 |
-1.541 |
13.117 |
|
Field |
Paddy |
3.442 |
2.719 |
0.586 |
-3.644 |
10.528 |
|
Field (Alpine) |
-32.729*
|
6.658 |
0.000 |
-50.394 |
-15.064 |
|
Vinyl house |
-26.941*
|
6.875 |
0.001 |
-45.115 |
-8.767 |
|
Field (Alpine) |
Paddy |
32.729*
|
6.658 |
0.000 |
15.064 |
50.394 |
|
Field |
26.941*
|
6.875 |
0.001 |
8.767 |
45.115 |
|
Vinyl house |
30.383*
|
6.619 |
0.000 |
12.809 |
47.958 |
|
Vinyl house |
Paddy |
2.346 |
2.110 |
0.683 |
-3.169 |
7.860 |
|
Field |
-3.442 |
2.719 |
0.586 |
-10.528 |
3.644 |
|
Field (Alpine) |
-30.383*
|
6.619 |
0.000 |
-47.958 |
-12.809 |
Table 6.
Multiple comparisons of event mean concentrations (EMCs) of suspended solids (SS) among land use types.
|
Type |
Mean difference (I-J) |
Std. Error |
p-value |
Confidence interval
|
|
95% Lower |
95% Upper |
|
Games-Howell |
Paddy |
Field |
-792.644*
|
131.868 |
0.000 |
-1138.966 |
-446.323 |
|
Field (Alpine) |
-1822.537*
|
232.739 |
0.000 |
-2442.638 |
-1202.434 |
|
Vinyl house |
-165.837*
|
41.738 |
0.001 |
-275.298 |
-56.376 |
|
Field |
Paddy |
792.644*
|
131.868 |
0.000 |
446.323 |
1138.966 |
|
Field (Alpine) |
-1029.89*
|
266.338 |
0.010 |
-1729.694 |
-330.089 |
|
Vinyl house |
626.807*
|
136.054 |
0.000 |
270.361 |
983.254 |
|
Field (Alpine) |
Paddy |
-1822.537*
|
232.739 |
0.000 |
1202.434 |
2442.638 |
|
Field |
-1029.89*
|
266.338 |
0.010 |
330.089 |
1729.694 |
|
Vinyl house |
1656.699*
|
235.136 |
0.000 |
1031.121 |
2282.276 |
|
Vinyl house |
Paddy |
165.837*
|
41.738 |
0.001 |
56.376 |
275.298 |
|
Field |
-626.807*
|
136.054 |
0.000 |
-983.254 |
-270.361 |
|
Field (Alpine) |
-1656.699*
|
235.136 |
0.000 |
-2282.276 |
-1031.121 |
Table 7.
Multiple comparisons of event mean concentrations (EMCs) of total nitrogen (TN) among land use types.
|
Type |
Mean difference (I-J) |
Std. Error |
p-value |
Confidence interval
|
|
95% Lower |
95% Upper |
|
Games-Howell |
Paddy |
Field |
-2.862*
|
0.980 |
0.022 |
-5.418 |
-0.306 |
|
Field (Alpine) |
-11.161*
|
2.003 |
0.000 |
-16.475 |
-5.847 |
|
Vinyl house |
0.556 |
0.574 |
0.768 |
-0.945 |
2.057 |
|
Field |
Paddy |
2.862*
|
0.980 |
0.022 |
0.306 |
5.418 |
|
Field (Alpine) |
-8.299*
|
2.126 |
0.001 |
-13.903 |
-2.694 |
|
Vinyl house |
3.418*
|
0.915 |
0.002 |
1.025 |
5.812 |
|
Field (Alpine) |
Paddy |
11.161*
|
2.003 |
0.000 |
5.847 |
16.475 |
|
Field |
8.299*
|
2.126 |
0.001 |
2.694 |
13.903 |
|
Vinyl house |
11.717*
|
1.972 |
0.000 |
6.475 |
16.960 |
|
Vinyl house |
Paddy |
-0.556 |
0.574 |
0.768 |
-2.057 |
0.945 |
|
Field |
-3.418*
|
0.915 |
0.002 |
-5.812 |
-1.025 |
|
Field (Alpine) |
-11.717*
|
1.972 |
0.000 |
-16.960 |
-6.475 |
Table 8.
Multiple comparisons of event mean concentrations (EMCs) of total phosphorus (TP) among land use types.
|
Type |
Mean difference (I-J) |
Std. Error |
p-value |
Confidence interval
|
|
95% Lower |
95% Upper |
|
Games-Howell |
Paddy |
Field |
-1.361*
|
0.200 |
0.000 |
-1.887 |
-0.835 |
|
Field (Alpine) |
-6.630*
|
1.035 |
0.000 |
-9.386 |
-3.875 |
|
Vinyl house |
-1.621*
|
0.266 |
0.000 |
-2.324 |
-0.919 |
|
Field |
Paddy |
1.361*
|
0.200 |
0.000 |
0.835 |
1.887 |
|
Field (Alpine) |
-5.269*
|
1.053 |
0.000 |
-8.066 |
-2.471 |
|
Vinyl house |
-0.260 |
0.330 |
0.859 |
-1.121 |
0.600 |
|
Field (Alpine) |
Paddy |
6.630*
|
1.035 |
0.000 |
3.875 |
9.386 |
|
Field |
5.269*
|
1.053 |
0.000 |
2.471 |
8.066 |
|
Vinyl house |
5.009*
|
1.067 |
0.000 |
2.178 |
7.839 |
|
Vinyl house |
Paddy |
1.622*
|
0.266 |
0.000 |
0.919 |
2.324 |
|
Field |
0.260 |
0.330 |
0.859 |
-0.600 |
1.121 |
|
Field (Alpine) |
-5.009*
|
1.067 |
0.000 |
-7.839 |
-2.178 |
References
2. J. Y. Choi, C. M. Shin, Stormwater runoff management plan for reducing non-point pollution source runoff, Korea Environment Institute2002, pp. 1-220(2002).
3. H. I. Jeong, Non-point pollution characteristics and treatment methods, Journal of the Korean Society of Hazard Mitigation., 9(3), 23-33(2009).
4. L. H. Kim, Management Cases and Implications of Watershed Nonpoint Pollution Sources for Green Algae Management - Focused on nonpoint pollution sources in agriculture and livestock-, Journal of Water Policy & Economy., 33, 5-22(2020).
5. J. R., Alternative to water quality management, Rural Research Institute KRC., 18, 1-22(2013).
6. Y. Ahn, S. H. Choi, H. I. Kim, Evaluation of water purification in the constructed wetland, J. Korean Soc. Water Environ. Eng., vol. 2006, 349-356(2006).
7. D. D. Poudel, Surface water quality monitoring of an agricultural watershed for nonpoint source pollution control, J. Soil and Water Conservation., 71(4), 310-326(2016).  8. G. H. Kim, Y. C. Kim, D. R. Lee, H. Y. Jung, J. H. Yur, J. Korean Soc. Environ. Eng., 25(6), 760-770(2003).
9. NPS Control Program for the Republic of Korea’s 3rd National Comprehensive Nonpoint Source Pollution Management Plan 2021-2025 Ministry concerned Joint, korea pp. 1-134(2020).
10. C. G. Yun, Development of integrated management technology for Agricultural Non-point pollution and institution improvement research, Magazine of the Korean Society of Agricultural Engineers., 52, 2-14(2010).
11. J. Y. Choi, E. S. Shin, Research for management measure of non-point pollution at agricultural region, Korea Environment Institute., 1998, 1-155(1998).
12. Youn Hee. Park, Seok Soon. Park, Development of Non-Point Source Pollution Loading Function Based on Rainfall Intensity and Land Use Type, J. Korean Soc. Environ. Eng., 26(10), 1070-1078(2004).
13. Environmental indicators of water quality in the United States EPA, USEPA, Washington, DC, pp. 1-52(1996).
14. V. Novotny, Non point pollution and urban stormwater management(Vol.9) CRC Press pp. 1-450(1995).
15. D. Sharma, R. Gupta, R. K. Singh, A. Kansal, Characteristics of the event mean concentration (EMCs) from rainfall runoff on mixed agricultural land use in the shoreline zone of the Yamuna River in Delhi, Applied Water Science., 2(1), 55-62(2011). 16. J. S. Ma1, S. Khan1, Y. X. Li1, H. K. Lee, S. Ha1, S. L. Lau, M. Kayhanian, M. K. Stenstrom, First flush phenomena for highways: how it can be meaningfully defined. Global Solutions for Urban Drainage., 1-11(2002).
17. S. Li, X. Wang, B. Qiao, J. Li, J. Tu, First flush characteristics of rainfall runoff from a paddy field in the Taihu Lake watershed, Environmental Science and Pollution Research., 24(9), 8336-8351(2017). 18. J. T. Smullen, A. L. Shallcross, K. A. Cave, Updating the US nationwide urban runoff quality data base, Water Science and Technology., 39(12), 9-16(1999). 19. H. K. Kwon, S. H. Shin, G. S. Kim, Y. G. Kim, D. S. Shin, T. H. Lm, The Calculation of NPS Load per Unit Area in Paddy Fields to the Nakdong River Basin, J. Korean Soc. Hazard Mitig., 17(3), 409-419(2017). 20. C. H. Won, Y. H. Choi, J. Y. Seo, K. C. Kim, M. H. Shin, J. D. Choi, Research Paper: Determination of EMC and Unit Loading of Rainfall Runoff from Forestry-Crops Field, Journal of Korean Society on Water Environment., 25(4), 615-623(2009).
21. C. H. Won, Y. H. Choi, M. H. Shin, D. S. Shin, D. G. Kang, J. D. Choi, Research Paper: Runoff Characteristics of NPS Pollution on Field in Rainy Season, Journal of Korean Society on Water Environment., 27(5), 572-579(2011).
22. J. C. Jeon, S. H. Lee, K. H. Kwon, J. W. Lee, H. G. Kwon, K. S. Min, Characteristics of Stormwater Runoff discharged from vinyl greenhouse growing area in farming area, Journal of Wetlands Research., 16(4), 413-422(2014). 23. J. C. Jeon, K. H. Kwon, S. H. Lee, J. W. Lee, H. G. Gwon, K. S. Min, EMC and Unit Loads of Pollutants Generated from Tomato Cultivation during Rainfall, Journal of Wetlands Research., 15(4), 555-566(2013). 24. Seong Su. Kim, Jong Seok. Kim, Ki Yeon. Bang, Eun Mi. Gwon, Wook Jin. Chung, The Estimation of the Unit Load and Chracteristics of Non-Point Source Discharge According to Rainfall in Kyongan Watershed, J. Korean Soc. Environ. Eng., 24(11), 2019-2027(2002).
25. J. H. Kim, K. H. Han, J. S. Lee, Research Paper : Characteristics of Agricultural Non-point Source Pollutants by Rainfall Events in Rural Watersheds, J. Korean Soc. Water Environ., 24(1), 69-77(2008).
26. D. G. Ra, K. S. Kim, Effects of Nonpoint Source Pollutants on Water Quality, Journal of Industrial Technology Institute., 10, 139-149(1996).
27. National Institute of Agricultural Sciences, Characteristics of agricultural non-point source pollution discharge and development of its integrated management practice Rural Development Administration pp. 1-114(2015).
28. G. U. Kim, M. S. Gang, I. H. Song, J. H. Song, Improvement mechanism of farming method development for reduction of non-point pollution on paddy, Magazine of the Korean Society of Agricultural Engineers., 57(1), 39-46(2015).
29. S. H. Park, S. G. Kim, S. Y. Moon, A Study on Management Method of Pumping & Drain Station Water Gate for Reduction of Agricultural Non-Point Pollution, Journal of Korea Society of Water Science and Technology., 27(1), 21-29(2019). 30. National Institute of Environmental Research, Total Maximum Pollutants Daily Load Ministry of Environment pp. 1-116(2019).
31. J. W. Lee, Y. J. Yi, H. G. Kwon, J. S. Yoon, C. S. Lee, S. U. Cheon, Estimation of Runoff Characteristics of Non-point Pollutant Source by Land Cover Characteristics, J. Korean Environmental Science International., 21(8), 977-988(2012). 32. S. C. Park, C. R. Oh, Y. H. Jin, D. S. Kim, Study on Runoff Characteristics of Non-point Source in Rural Area of Seomjin Watershed, J. Korean Environmental Science International., 14(11), 057-1062(2005).
33. J. H. Ahn, S. L. Yun, S. K. Kim, Runoff Characteristics of Non-Point Source according to Cultivation Activity in River District, J. KOREAN SOC. ENVIRONMENTAL ENGINEERS., 34(7), 480-487(2012). 34. S. C. Park, C. R. Oh, J. M. Kim, Characteristics of Non-Point Pollution Discharge of Urban Area According to Land Use, J. Korea Water Resour. Assoc., 1229-1233(2005).
35. J. D. Park, S. Y. Oh, O. Y. Choi, Research Paper: Analysis of Changes in Land Use and Pollution Load for the Unit Watersheds of Total Maximum Daily Loads, Journal of Korean Society on Water Environment., 30(2), 128-137(2014). 36. Y. Y. Choi, S. Y. Jung, J. W. Choi, Nonpoint Pollutants Sources Characteristics of Initial Surface Runoff on the Land Use Types, Journal of the Environmental Sciences., 20(3), 417-426(2011). 37. H. W. Lee, N. H. Choi, Y. S. Lee, J. H. Choi, Estimation of Pollutants Loading from Non-Point Sources Based on Rainfall Event and Land use Characteristics, J. Korean Soc. Environ. Eng., vol. 33, 572-577(2011). 38. KICT, The Optimum Management Plans and Runoff Characteristics of Nonpoint Souce for PalDang Watershed pp. 1-368(2000).
39. G. B. Lee, J. C. Kim, J. H. Park, D. B. Lee, J. G. Kim, Originals : Assessment of Pollutant Loads for Water Enhancement in the Jeongeupcheon of Dongjin River, Korean Journal of Environmental Agriculture., 23(1), 41-46(2004).
40. H. Y. Kim, Analysis of variance (ANOVA) comparing means of more than two groups, Restorative Dentistry & Endodontics., 39(1), 74-77(2014). 41. J. Gamage, S. Weerahandi, Size performance of some tests in one-way ANOVA, Communications in Statistics-Simulation and Computation., 27(3), 625-640(1998). 42. S. S. Lee, D. K. Lee, What is the proper way to apply the multiple comparison test?, Korean journal of anesthesiology., 71(5), 353-360(2018). 43. P. A. Games, J. F. Howell, Pairwise multiple comparison procedures with unequal n’s and/or variances: A Monte Carlo study, Journal of Educational Statistics., 1(2), 113-125(1976). 44. J. W. Jung, D. H. Choi, K. S. Yoon, Research Paper : Selecting probability distribution of event mean concentrations from paddy fields, Journal of Environmental Impact Assessment., 23(4), 285-295(2014). 45. D. H. Choi, J. W. Jung, K. S. Yoon, W. J. Choi, S. G. Kim, Goodness of fit test for probability distribution of EMCs of commercial area and paddy field, J. Korean Soc. of Water and Wastewater., 2014, 634-635(2014).
46. J. W. Jung, K. S. Yoon, W. J. Choi, S. S. Lim, J. H. Kwak, Y. J. Huh, S. H. Lee, N. I. Chang, Probability Distribution of Event Mean Concentration from Paddy Field, J. Korean Soc. of Water and Wastewater., 2007, 57-760(2007).
47. J. S. Kim, C. G. Yoon, J. P. Cho, M. S. Cho, J. H. Ryu, Analysis of Stormwater Runoff Characteristic for Paddy Field in Reclaimed Land, J. Korean Soc. of Water and Wastewater., 2012, 536-537(2012).
48. W. J. Park, J. H. Jeon, H. S. Lee, S. H. Hwang, Y. J. Lee, J. D. Choi, Runoff Characteristics of NPS pollution from Paddy Field in Rainy Season, J. Korean Soc. of Water and Wastewater., 2015, 483-484(2015).
49. S. G. Yoon, Analysis of probability distribution of EMCs(event means concentration) from paddy fields, Chonnam National University., Gwangju, 1-124(2008).
50. K. S. Yoon, J. Y. Choi, K. H. Han, J. Y. Cho, Flow Weighted Mean Concentration and Runoff -Mass Load Relationship of Pollutants Derived from Intensively Sampled Water Quality Data of a Paddy Field, Magazine of the Korean Society of Agricultural Engineers., 44(5), 127-135(2002).
51. Y. S. Yoon, S. H. Lee, J. J. Yu, J. K. Lee, Analysis of Nonpoint Sources Runoff Characteristic for the Vineyard Areas, J. Korean Environmental Science International., 20(3), 361-372(2011). 52. S. H. Jo, Pollutant loads caused by the runoff discharged from the cultivated land Andong National University, Andong, pp. 1-122(2010).
53. Y. H. Choi, C. H. Won, J. Y. Seo, M. H. Shin, H. J. Yang, K. J. Lim, J. D. Choi, Research Paper : Analysis and Comparison about NPS of Plane Field and Alpine Field, Journal of Korean Society on Water Environment., 25(5), 682-688(2009).
54. J. Y. Shin, M. H. Shin, Y. H. Choi, H. W. Kang, C. H. Won, M. Y. Hwang, H. J. Yang, K. J. Lim, J. D. Choi, Effect of Balloonflower and Potato Cultivation on Runoff and NPS Pollution Loads, Journal of the Korean Society of Agricultural Engineers., 54(6), 89-99(2012). 55. M. A. Kang, S. H. Jo, B. W. Choi, Y. S. Yoon, J. K. Lee, Loading Characteristics of Non-Point Source Pollutants by Rainfall -Case Study with Sweet Potato Plot-, Korean Society of Engineering Geology., 19(3), 365-371(2009).
56. M. A. Kang, B. W. Choi, J. J. Yu, Loading Characteristics of Non-Point Source Pollutants by Rainfall -Case Study with Cherry Tree Plot-, Korean Society of Engineering Geology., 20(4), 401-407(2010).
57. S. I. Lee, C. H. Won, M. H. Shin, J. Y. Shin, J. H. Jeon, J. D. Choi, Analysis of NPS Pollution reduction from No-till Field, Journal of the Korean Society of Agricultural Engineers., 57(4), 51-59(2015). 58. I. H. Song, M. S. Kang, S. H. Hwang, J. H. Son, Characteristics and EMCs of NPS Pollutants Runoff from a Forest-Paddy Composite Watershed, Journal of the Korean Society of Agricultural Engineers., 54(4), 9-17(2012). 59. S. M. Jung, C. W. Jang, J. K. Kim, B. C. Kim, Research Paper : Characteristics of Water Quality by Storm Runoffs from Intensive Highland Agriculture Area in the Upstream of Han River Basin, Journal of Korean Society on Water Environment., 25(1), 102-111(2009).
60. J. Y. Lee, J. S. Kim, Characteristics of pollutant runoff from sloping upland field during multiple storms, J. Korea Water Resour. Assoc., 2015, 399-399(2015).
61. S. I. Lee, J. Y. Shin, M. H. Shin, S. H. Joo, J. Y. Seo, W. J. Park, J. Y. Lee, J. D. Choi, Characteristics of Non-Point Pollutant Runoff in Highland Field Fields through Long-term Monitoring, Journal of the Korean Society of Agricultural Engineers., 59(4), 85-96(2017).
62. Y. H. Choi, C. H. Won, W. J. Park, M. H. Shin, J. Y. Shin, S. I. Lee, H. J. Yang, J. D. Choi, Comparison of Non-Point Pollution Occurrence by Amount of Fertilizer Applicetion from Sandy Loam Alpine Fields which Cultivetes Poteto and Radish in Korea, Korean National Committee on Irrigation and Drainage., 19(1), 40-49(2012).
63. Y. S. Yoon, S. H. Shin, J. J. Yu, C. K. Shin, Research for effluent character of organic matter comply with land use, Proceedings of the Korean Environmental Sciences Society Conference., 17(1), 381-384(2008).
64. Y. S. Yoon, S. H. Shin, J. J. Yu, C. K. Shin, Research for effluent character of Nutrients comply with land use, Proceedings of the Korean Environmental Sciences Society Conference., 17(1), 381-384(2008).
65. S. H. Choi, S. M. Lee, K. H. Kwon, S. W. Kim, K. S. Min, Runoff Characteristics of Non-Point Source Pollutants (NPS) from Vinyl House Area, Journal of Environmental Science International., 19(6), 62-65(2010).
66. Y. K. Kim, The Runoff Characteristics of Nonpoint Source Pollutants in Respective Greenhouse Crops Kyungpook National University, Daegu, pp. 1-96(2021).
67. J. H. Joo, Y. S. Jung, J. E. Yang, Y. S. Ok, S. E. Oh, K. Y. Yoo, S. C. Yang, Assessment of Pollutant Loads from Alpine Agricultural Practices in Nakdong River Basin, Korean Journal of Environmental Agriculture., 26(3), 233-238(2007). 68. J. P. Moon, T. C. Kim, B. G. Ahn, Load factor of Nonpoint Source Pollutant owing to Land Use in Bangdong Reservoir Watershed, Korean Journal of Agricultural Science., 26(2), 61-69(1999).
69. J. D. Choi, S. K. Kwun, G. S. Kwon, Evaluation of NPS Pollutant Loads from Clayey Loam Fields, Journal of the Korean Society of Agricultural Engineers., 46(2), 107-114(2004). 70. Y. C. Shin, J. D. Choi, K. J. Lim, H. H. Shim, C. W. Lyou, J. E. Yang, K. Y. Yoo, Pollutant Load Characteristics from a Small Mountainous Agricultural Watershed in the North Han River Basin, Journal of the Korean Society of Agricultural Engineers., 47(6), 83-92(2005). 71. B. W. Gu, S. J. Park, Effects of Fertilization on Ponded Water and Soil Quality in Organic and Conventional Paddy, Journal of Korea Society of Water Science and Technology., 24(5), 139-152(2016). 72. K. U. Kim, M. S. Kang, I. H. Song, J. H. Song, J. H. Park, S. M. Jun, J. R. Jang, J. S. Kim, Effects of Controlled Drainage and Slow-release Fertilizer on Nutrient Pollutant Loads from Paddy Fields, Journal of the Korean Society of Agricultural Engineers., 58(1), 1-10(2016). 73. H. S. Kim, J. S. Kim, Y. I. Kim, B. H. Cheong, Analysis of the Characteristics of Nutrients Loading and the Water Purification Function in the Paddy-fields, Korean National Committee on Irrigation and Drainage., 11(1), 34-44(2004).
|
|